Day-14 Alerts and Dashboards in Kibana

Let’s Create Alerts and Dashboards for Ubuntu Server Authentication Logs
Today, we’ll dive into creating alerts and dashboards in Kibana to visualize our Ubuntu server’s authentication logs.
- Log in to your cloud provider and access your Vultr or preferred cloud service account.
- Connect to Elasticsearch using your login credentials to connect to your Elasticsearch instance.
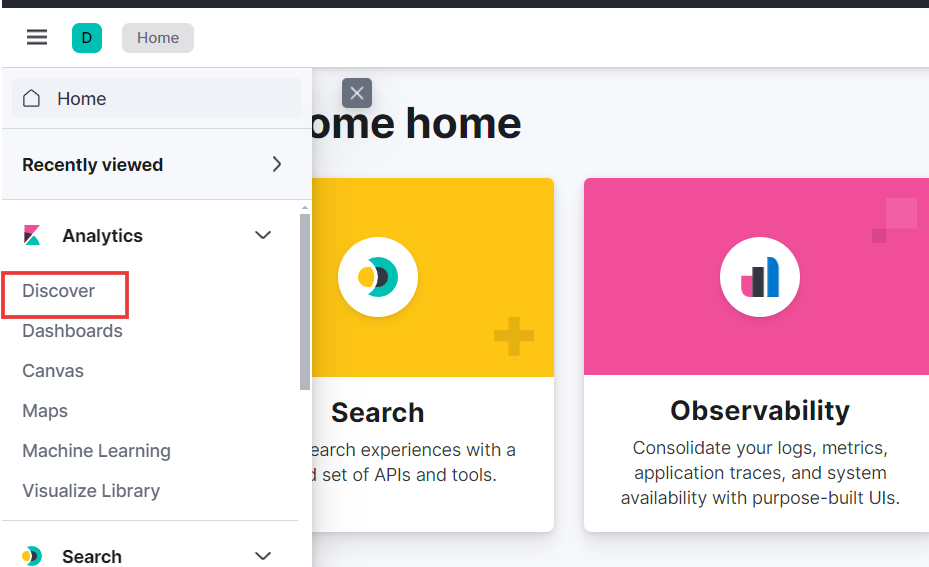
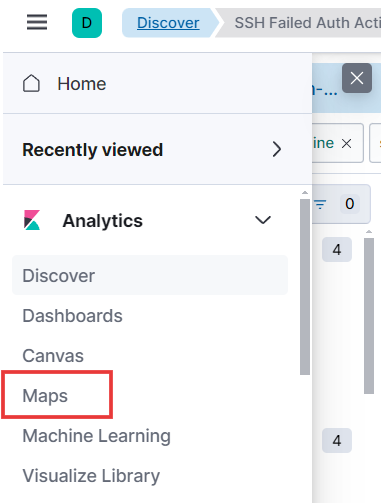
- Navigate to Kibana for that click on the hamburger icon and select “Discover” under “Analytics” to begin creating alerts and dashboards.
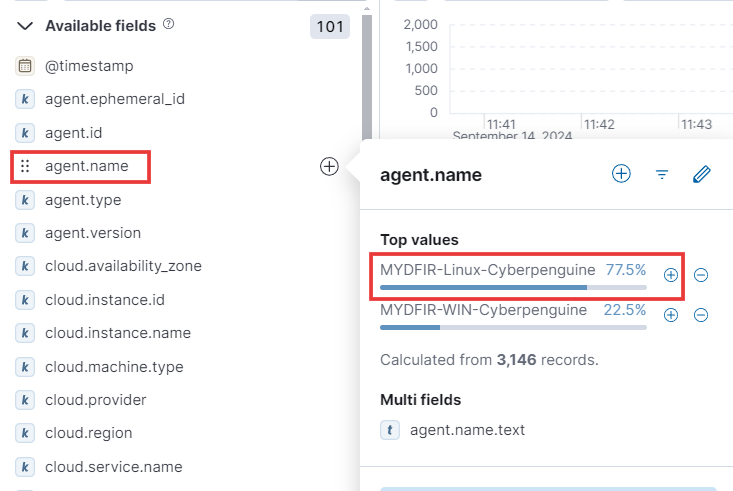
- Let’s dive into setting up an alert! Over on the left-hand pane, you’ll find a list of available fields. Look for the
agent.namefield. - Clicking on that field will reveal the two agents we created throughout the challenge. Since we’re interested in creating an alert for the Linux agent, let’s add it as a filter. Just click the plus icon to include it.
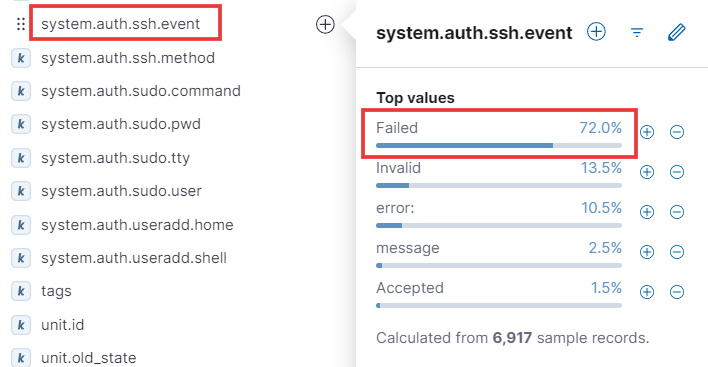
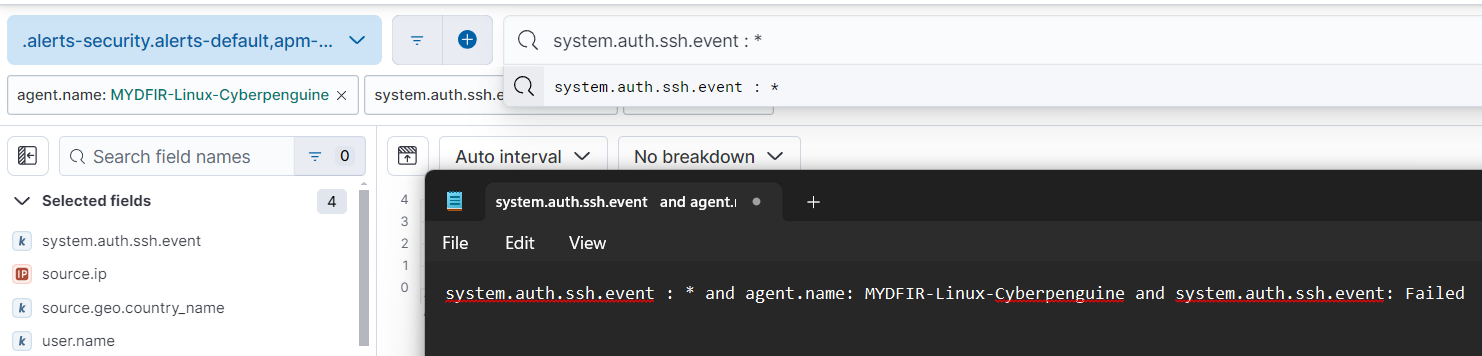
Let’s focus on system authentication events:
Next, we’ll look for the field named
system.ssh.auth.event. Click on this field to view the different types of system authentication events. We’re primarily interested in failed events. Let’s add this filter to our query.
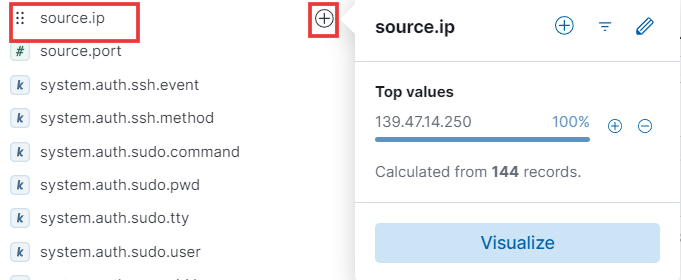
- Next field: Source IP. Knowing the source IP addresses of most SSH authentication attempts can help you identify and address potential security threats. Add this field to your table by clicking the plus icon.
- We’ll also add a column for the source country field. This will help us pinpoint the geographic origin of each log entry, providing valuable insights into potential threats and attack patterns.

- Now, let’s focus on the next field: username. This will help us identify which usernames are being targeted in the SSH brute force attacks.
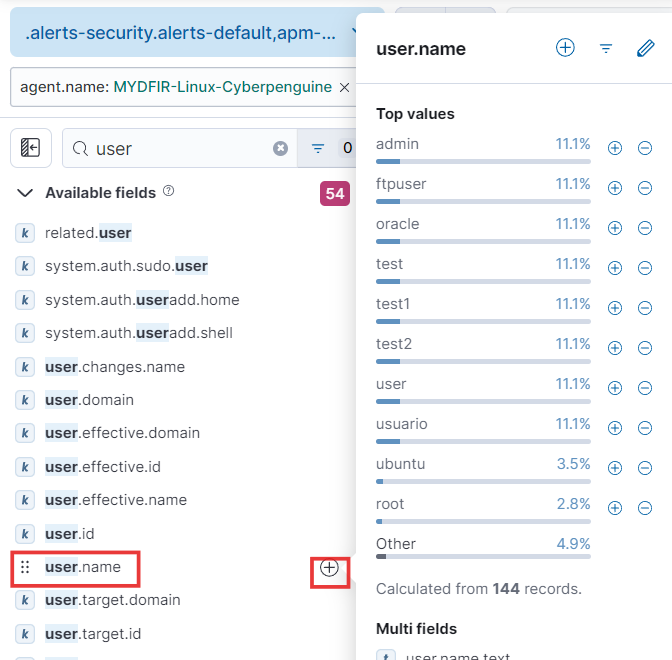
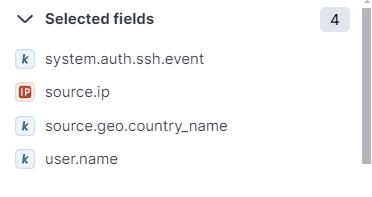
- These are all the selected fields.
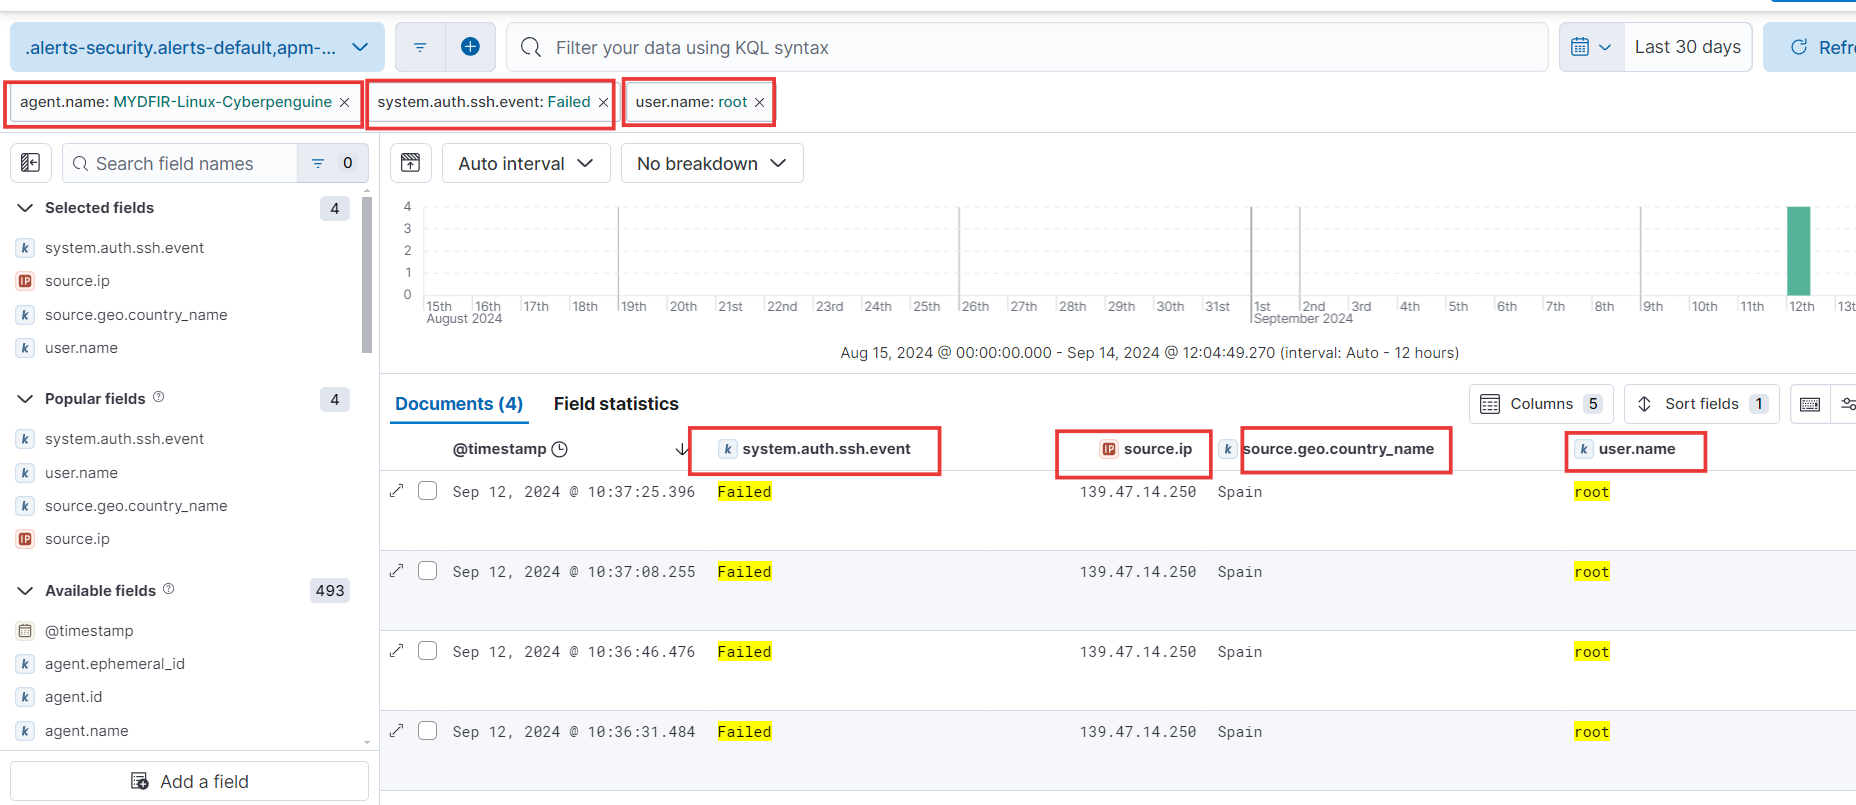
- And here’s what the results will look like after applying all the necessary filters and columns.
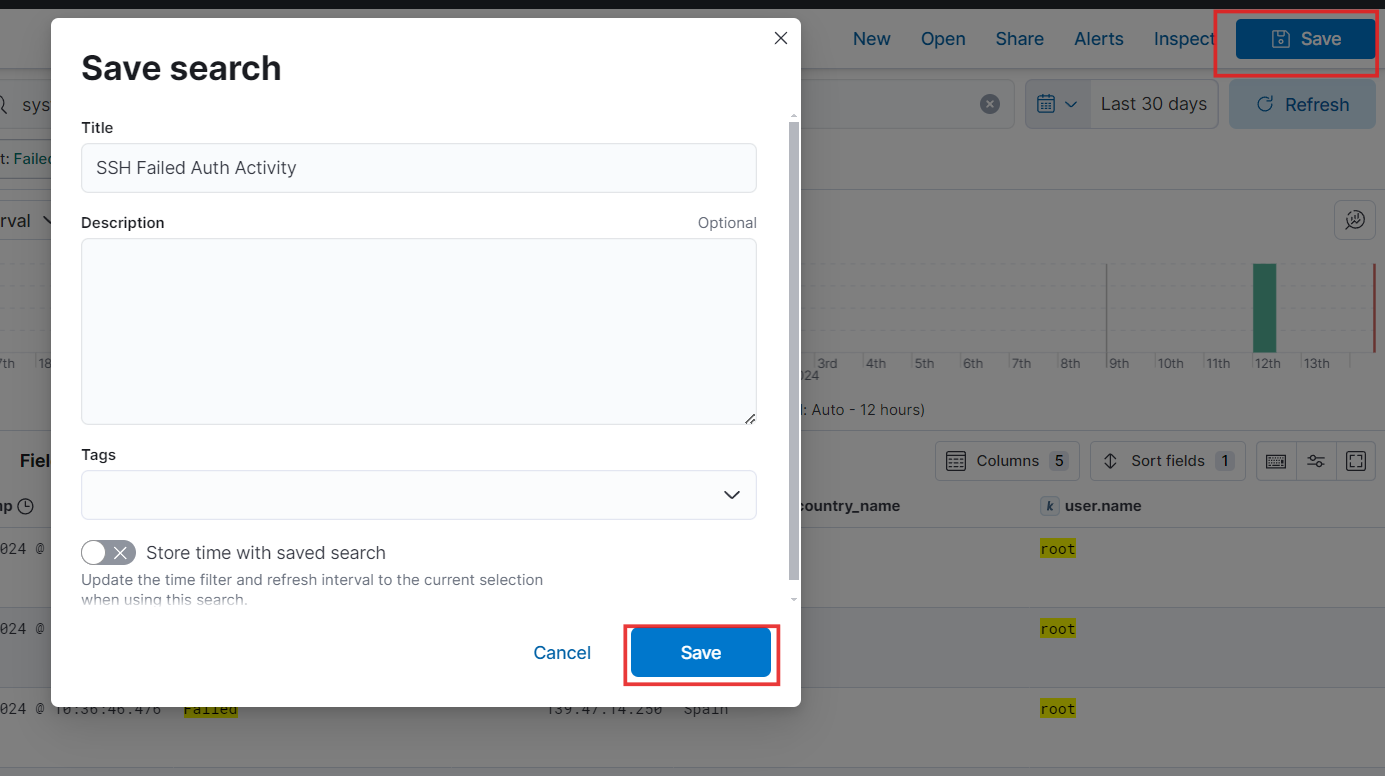
- Now, save your search by giving it an appropriate name.
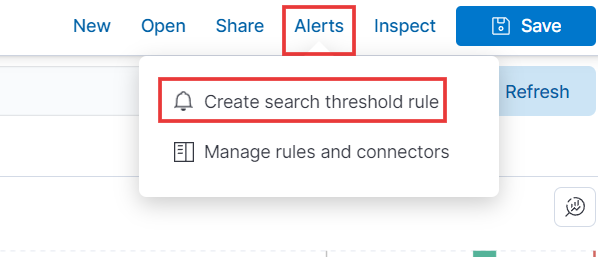
- Now, to create an alert, click on “Alerts” in the top right corner. Select the first option, “Create search threshold rule”.
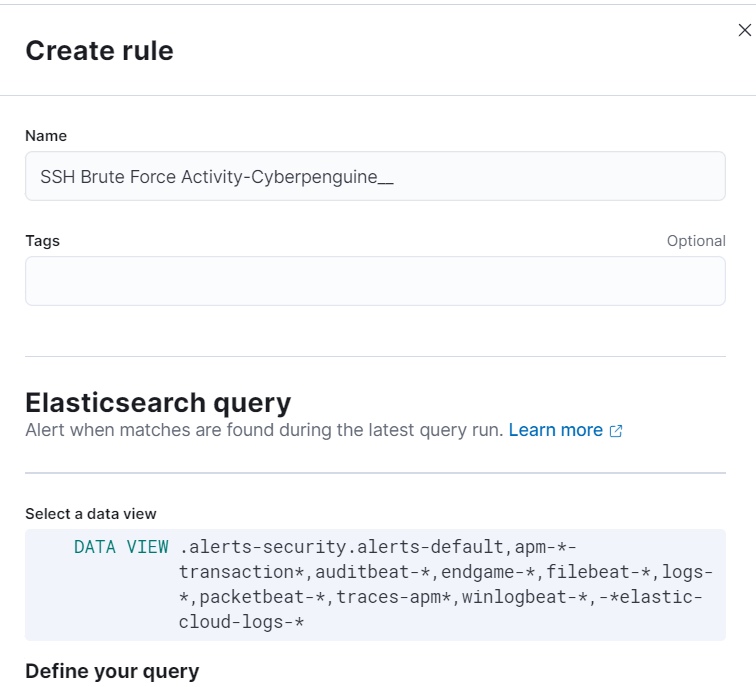
- Provide an appropriate name for your alert, and you’ll see the Elasticsearch query selected automatically.
- In the “Define Your Query” section, you’ll discover a comprehensive list of filters and conditions we’ve thoughtfully configured for our alerts. Feel free to customize these condition settings to match your specific needs.

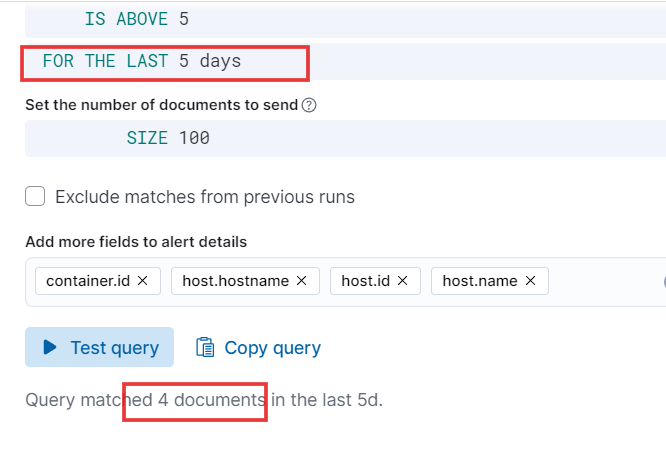
- To test the query, I’ll adjust the query time to 5 days, click the ‘Test Query’ button, and examine the results. As expected, the query is displaying 4 events that occurred within the last 5 days. After testing you can revert the changes.
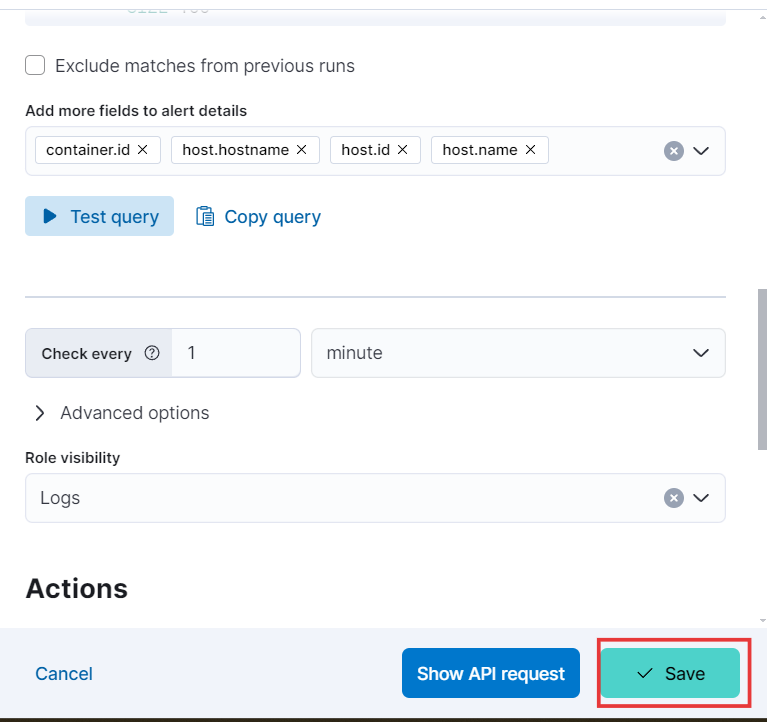
- Moving forward, we’ll see that the system will check for alert conditions every minute. You can customize this interval to suit your specific needs. Once you’ve finished configuring the alert, click the Save button to apply your changes.
- To create the map, let’s copy the filter query we’ve created.
- Now, let’s create a dashboard. From the Analytics menu, click on Maps.
- Paste your query into the search bar and then click the “Add Layer” button.
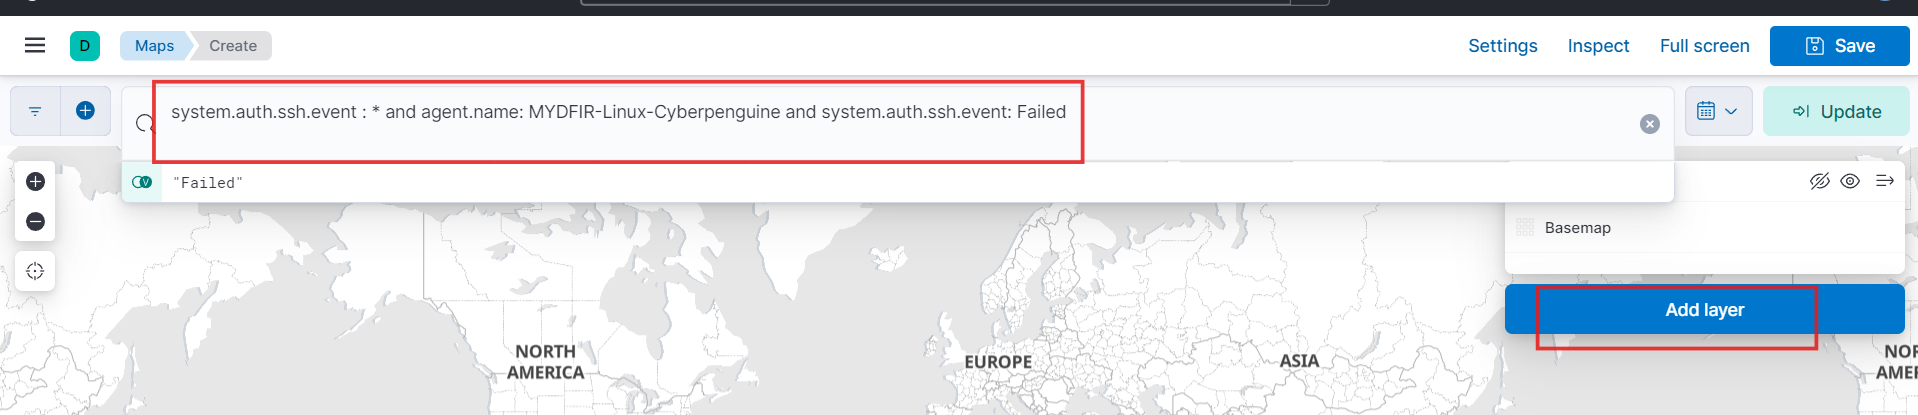
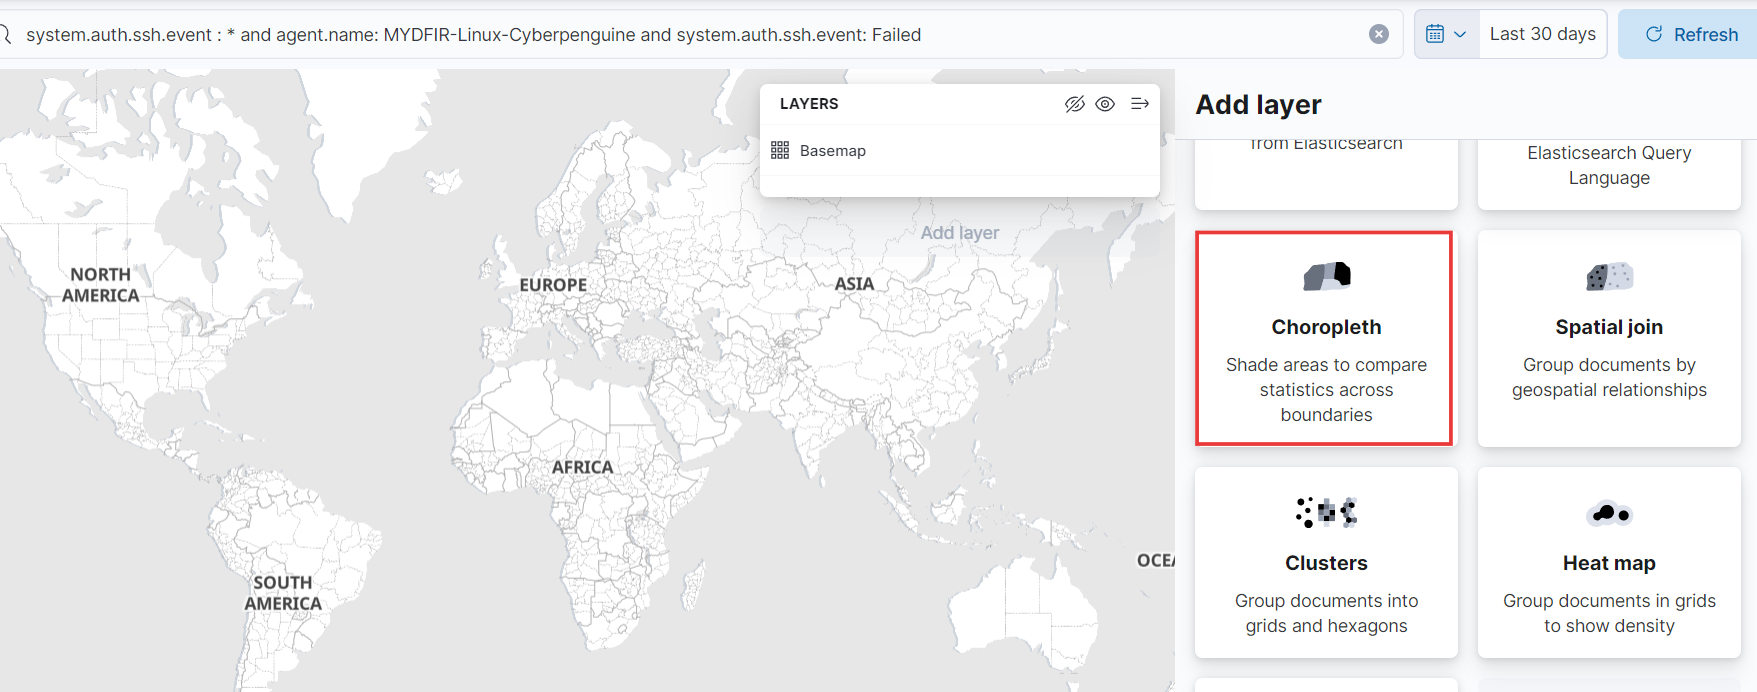
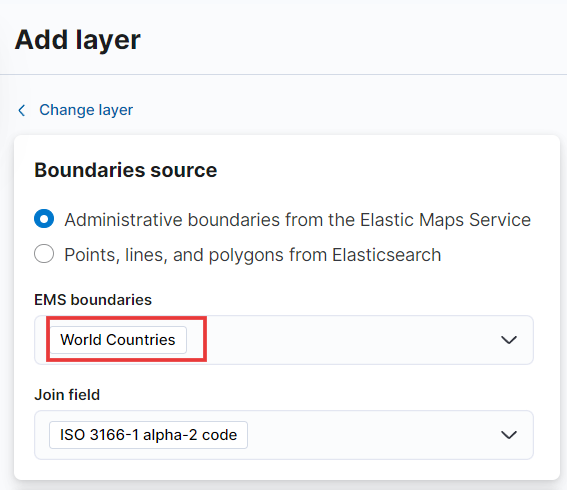
- Let’s use a Choropleth map. This type of map will shade geographical areas based on specific alert conditions.
- For source boundaries, we’ll select Administrative Boundaries and EMS boundries set to “World Countries.” This will help us identify brute force attack attempts from around the globe. Once you choose EMS boundaries, the join field will be automatically populated.
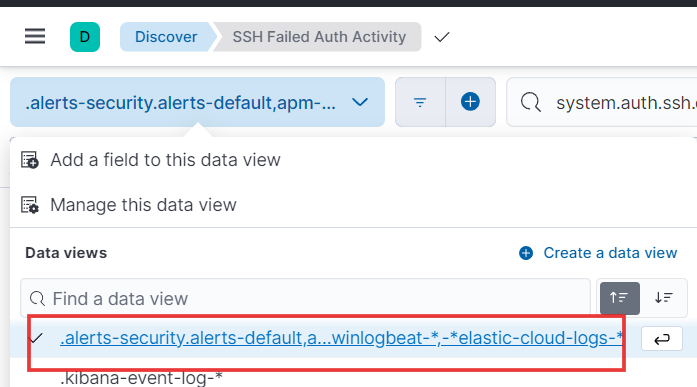
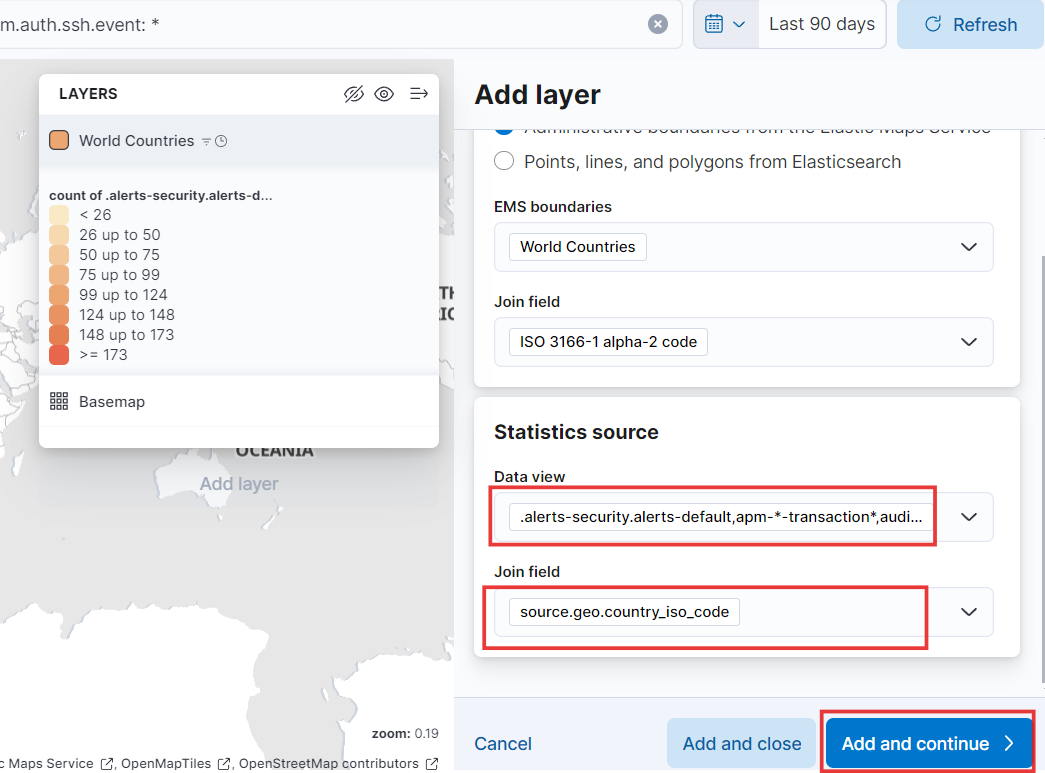
- Below is the data view from the Discover page. We’ll use this same view for our map.
- For the join field, select the “source geo country iso code.” Then, add and continue to create the map.
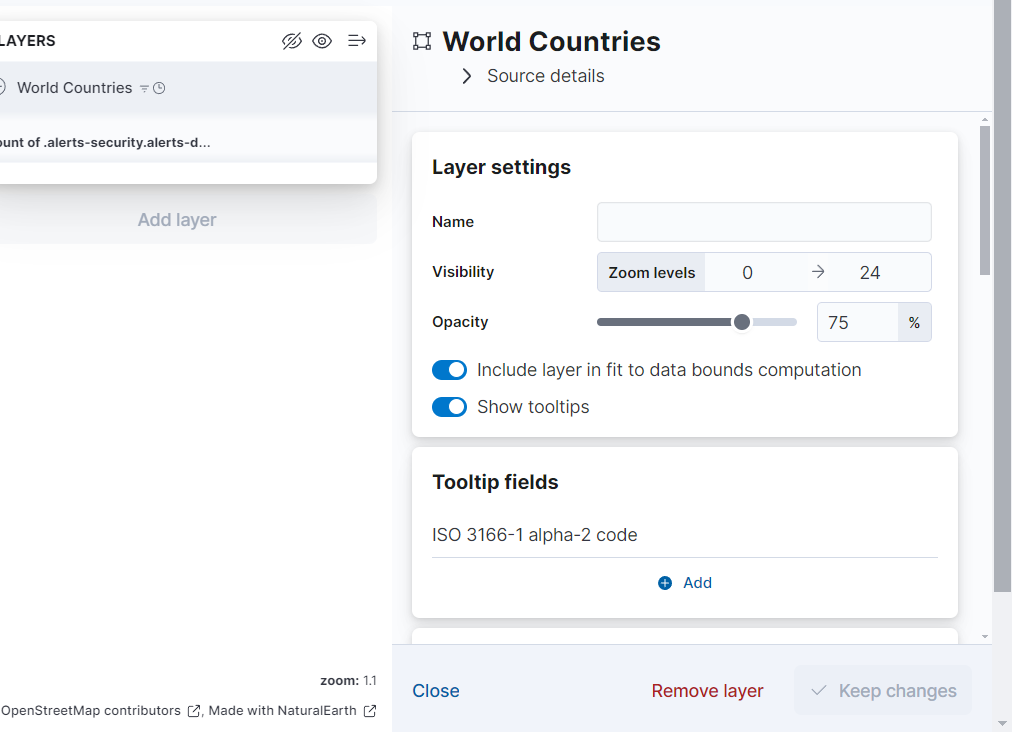
- You can customize your dashboard map further using the following options:
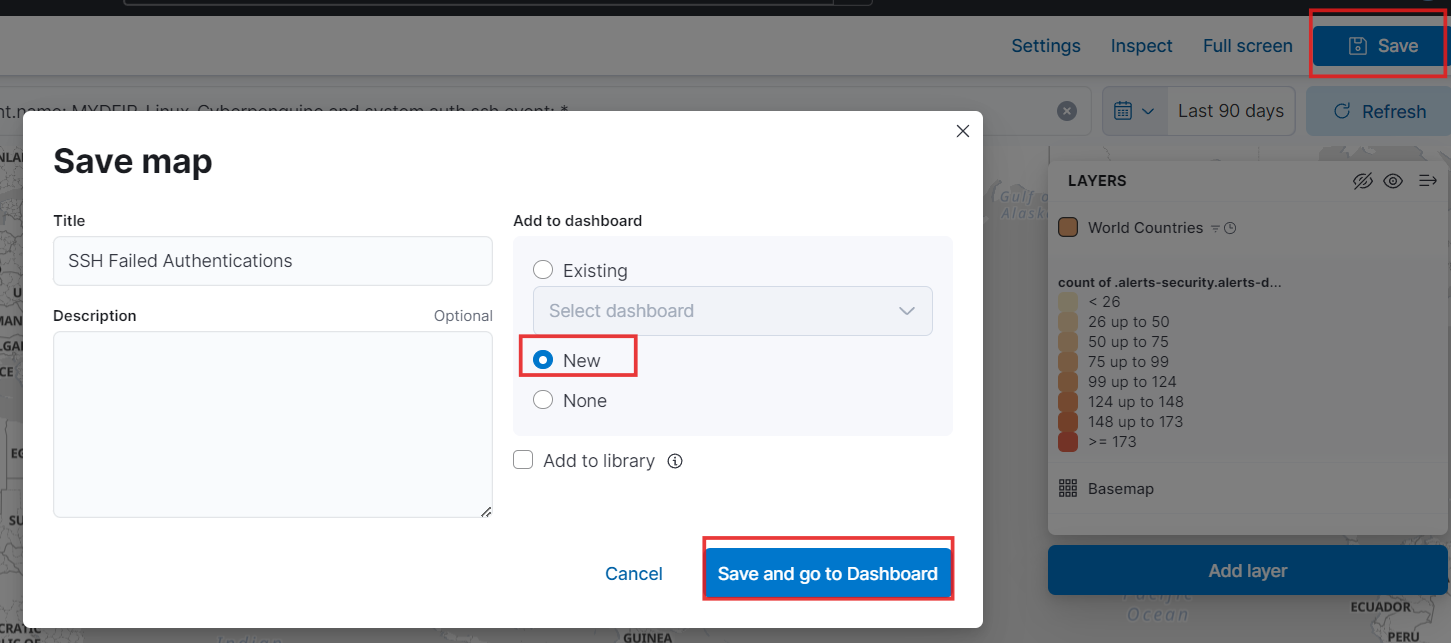
- Now, click “Save” in the upper right corner, give your map a name, and select “New” to add it to a new dashboard. Then, save your changes.
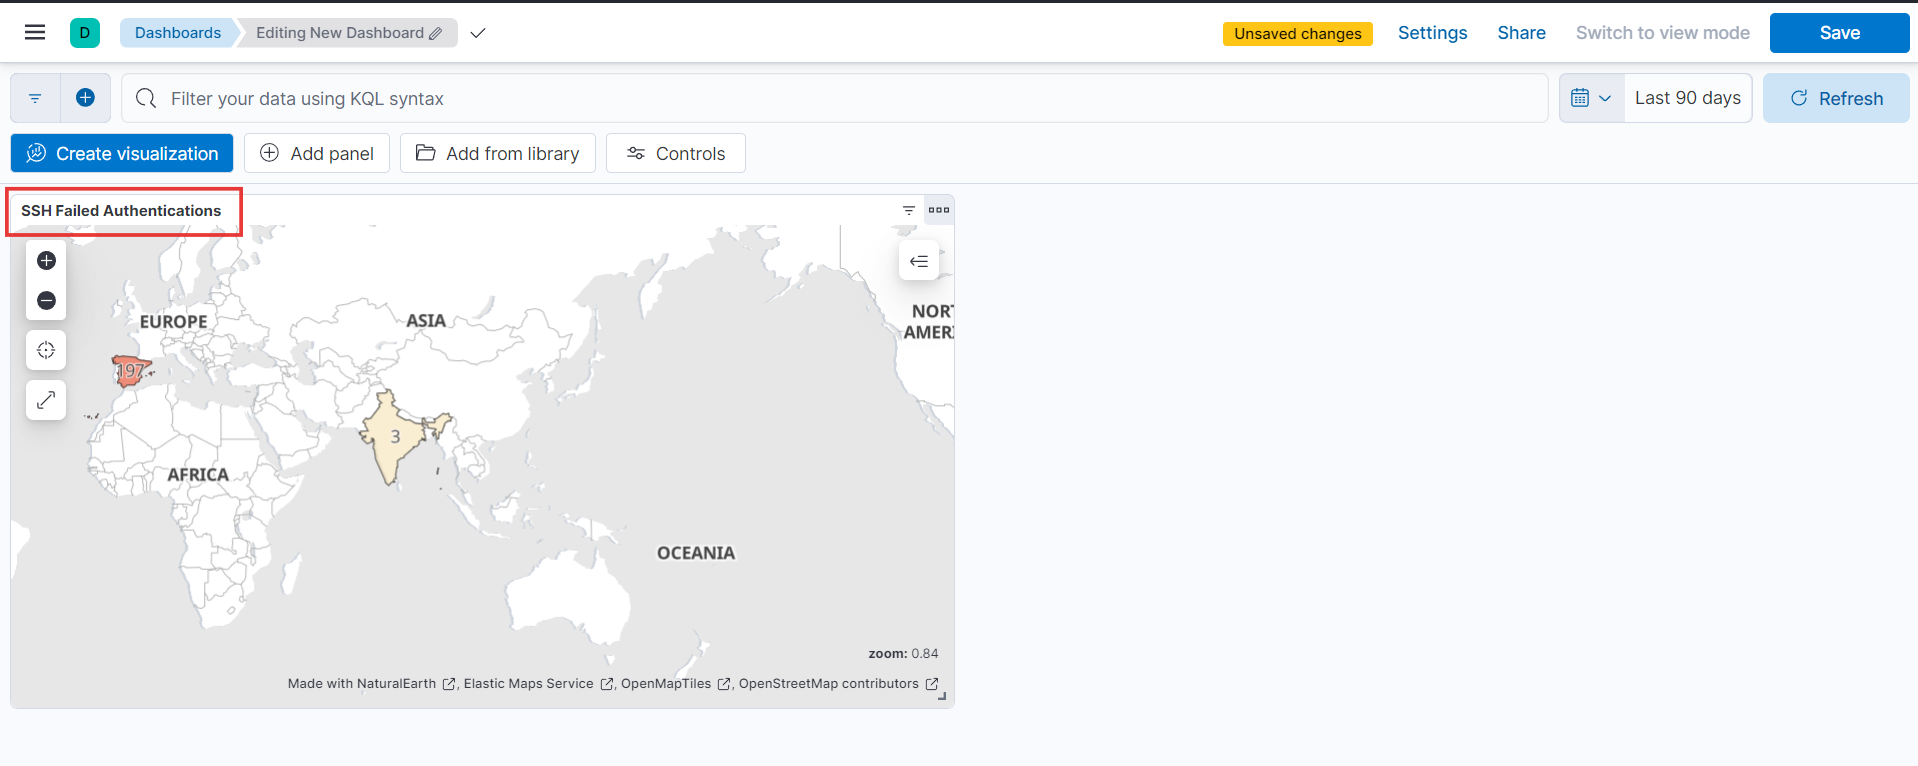
- After clicking “Save and Go to Dashboard,” you’ll be redirected to the dashboard. There, you’ll find your map displayed prominently.
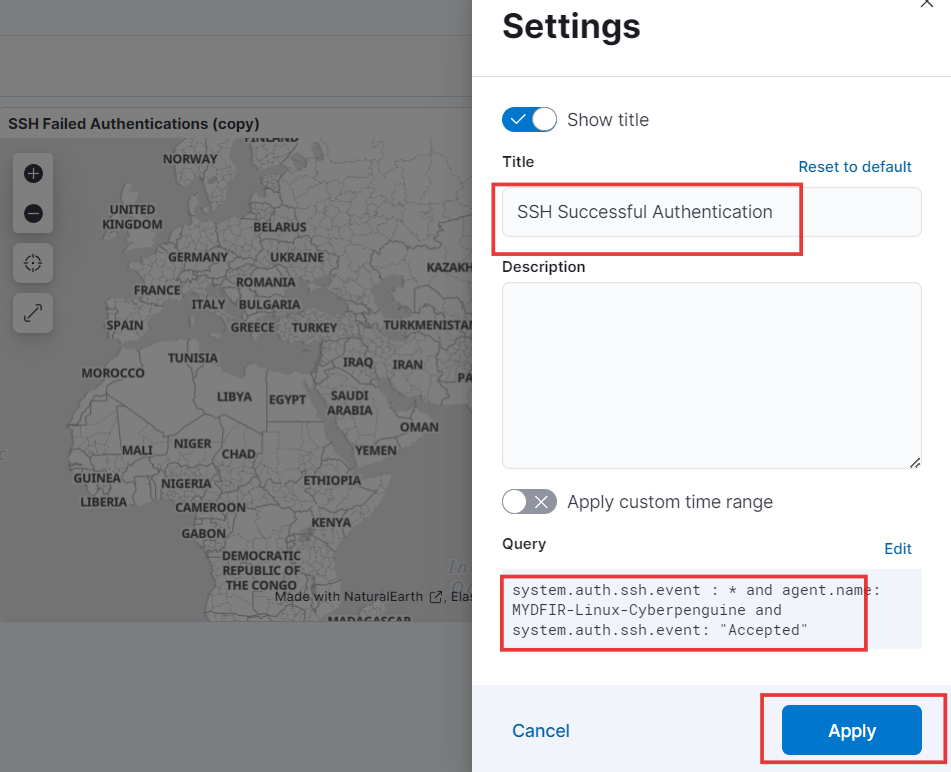
- Let’s create another map similar to this one, but focusing on successful attempts. To do this, duplicate the existing map by clicking on the three dots in the top right corner and selecting “Duplicate.”
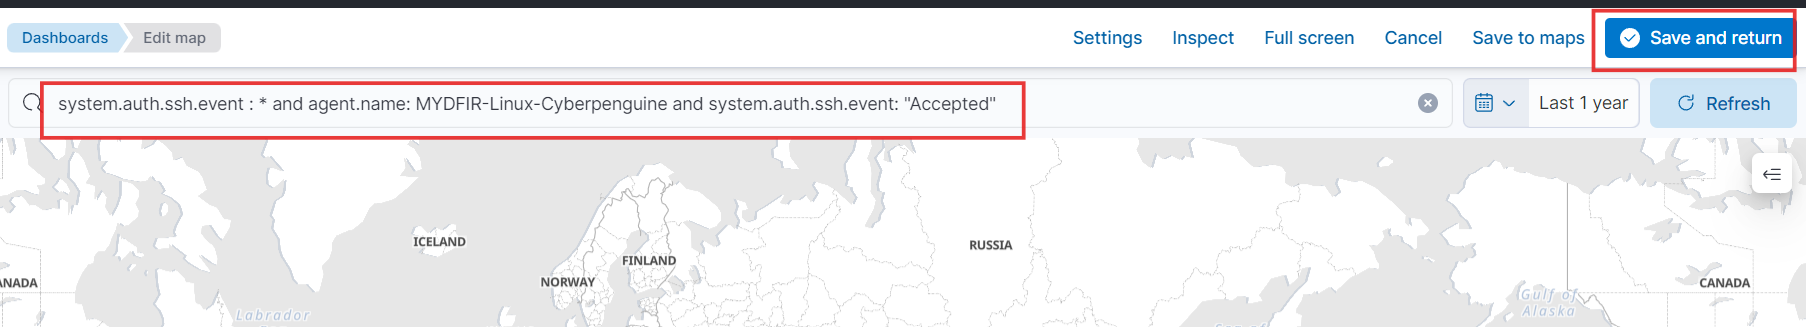
- From there, you can modify the map’s name and query as “Accepted” from “Failed” to reflect your desired changes. Once you’ve made the necessary adjustments, apply them to see the updated map.
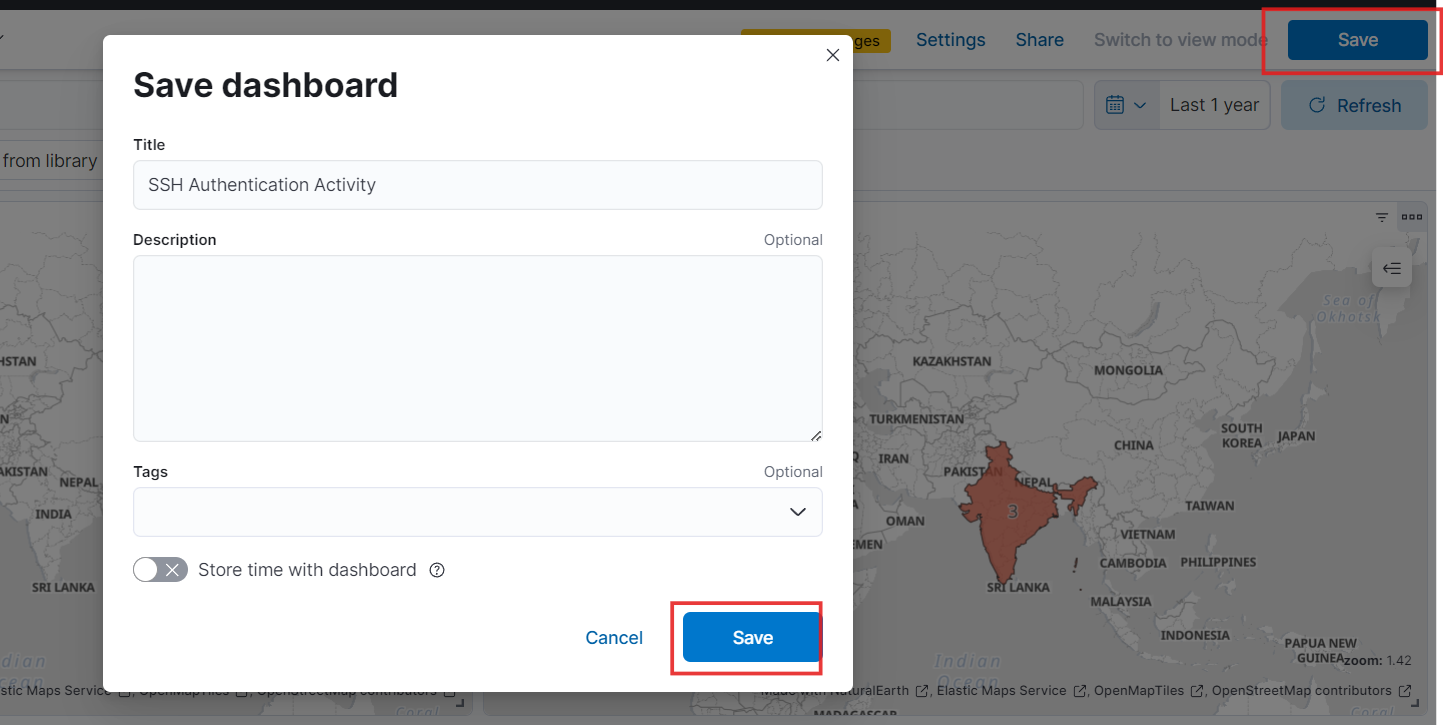
- Now, save the dashboard with a descriptive name and description.
- “Behold, the final masterpiece of my dashboard! Isn’t it a sight to behold?” 😍
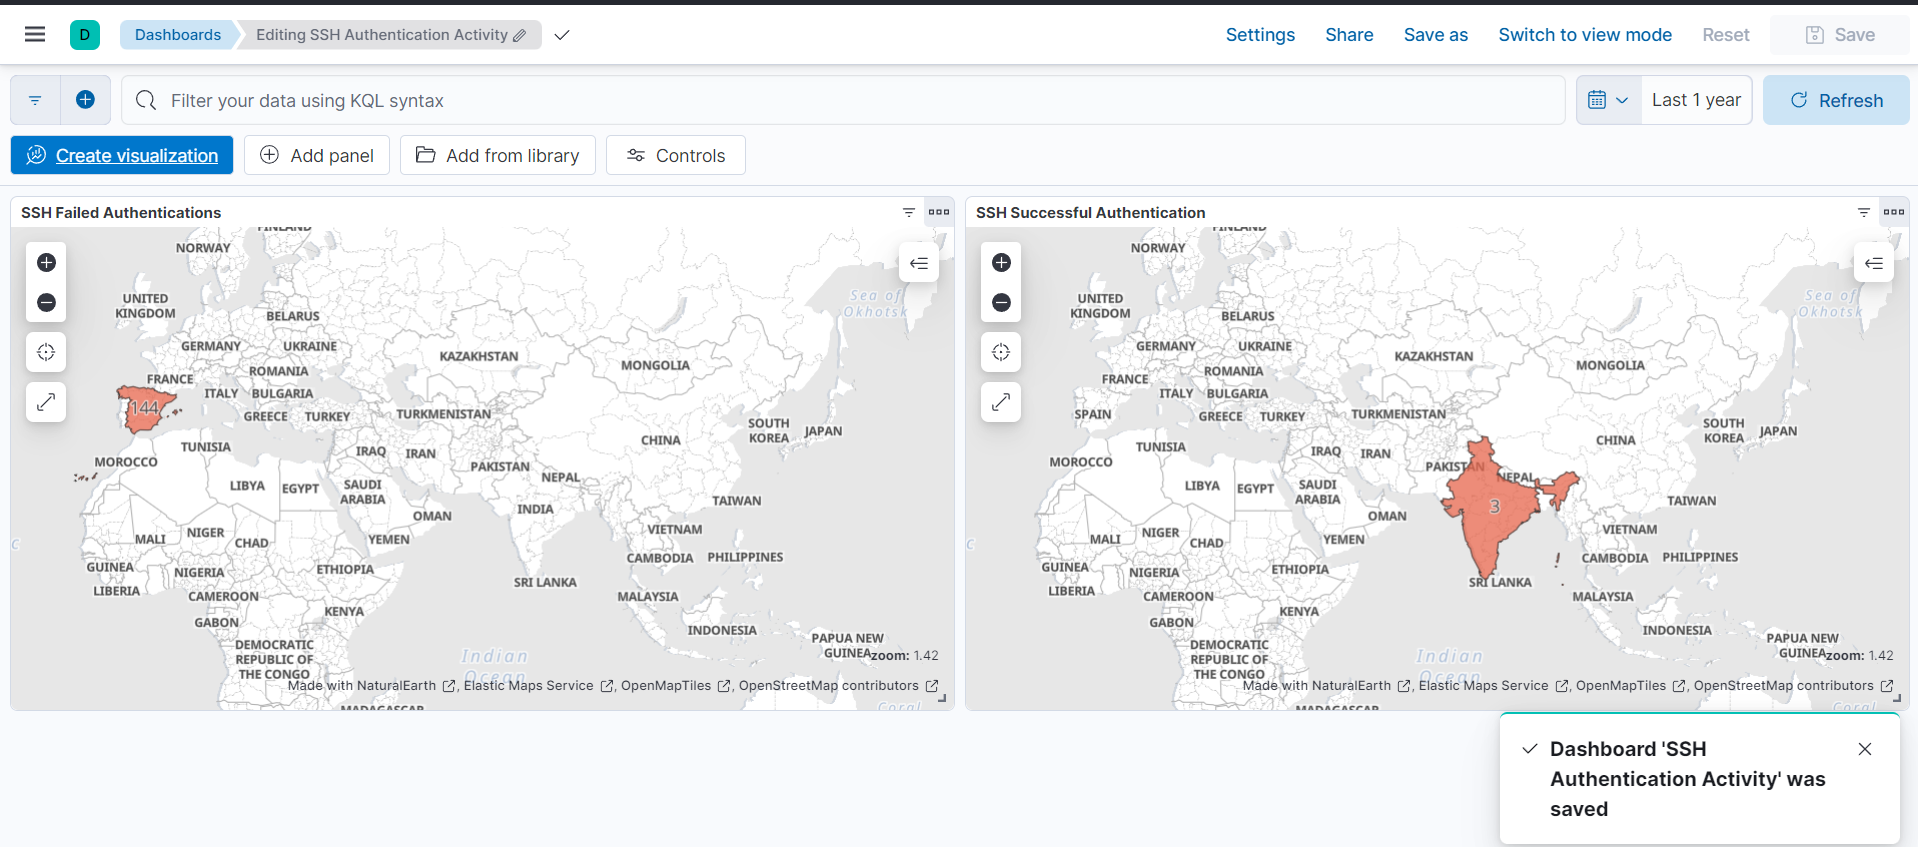
Great work! 🎉 We now have a powerful alert system in place that will trigger every 5 minutes for specific queries based on predefined conditions. This, combined with our user-friendly dashboard, provides a real-time view of any suspicious activity, such as attacks or brute force attempts, on our Ubuntu server.