Day-16 Creating Alert for Win and Rules
Let’s build on our knowledge! Today, we’re going to create alerts for Windows servers, just like we did for Ubuntu.
First things first: Log in to your Vultr account (or any cloud platform you prefer).
Next, let’s fire up those servers and head over to the Kibana dashboard. Use your login credentials to access it.
Now, let’s get discovering! Navigate to the Discover option under Analytics.
Time to hunt: Search for “failed windows authentication” and see what we find. Let’s see if we can catch those sneaky attackers red-handed!

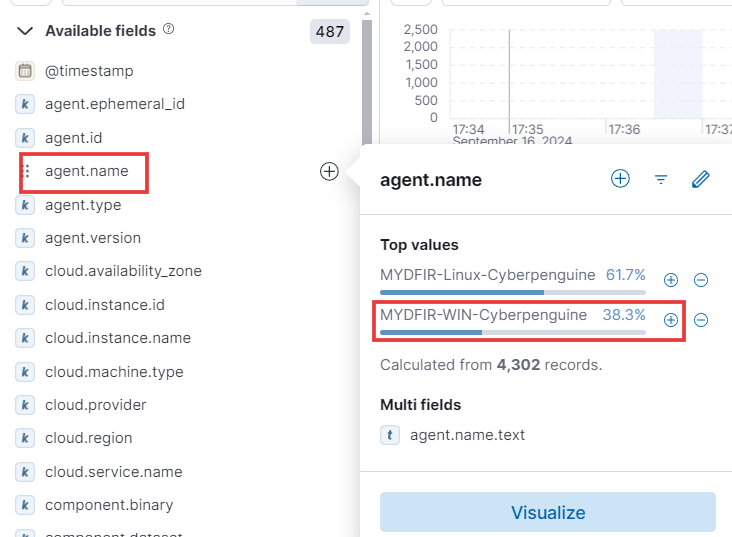
Let’s focus on just Windows logs! To filter effectively, we can target the
agent.namefield and choose only options related to Windows agents. This ensures we analyze logs specific to Windows systems.
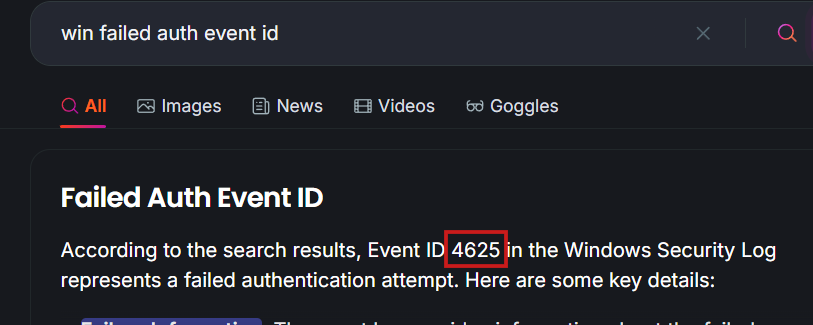
Curious about the event ID for failed authentication logs on Windows?
If you’re not familiar, it’s a simple search away. The event ID is 4625.
Let me know if you have any other questions about Windows security logs!
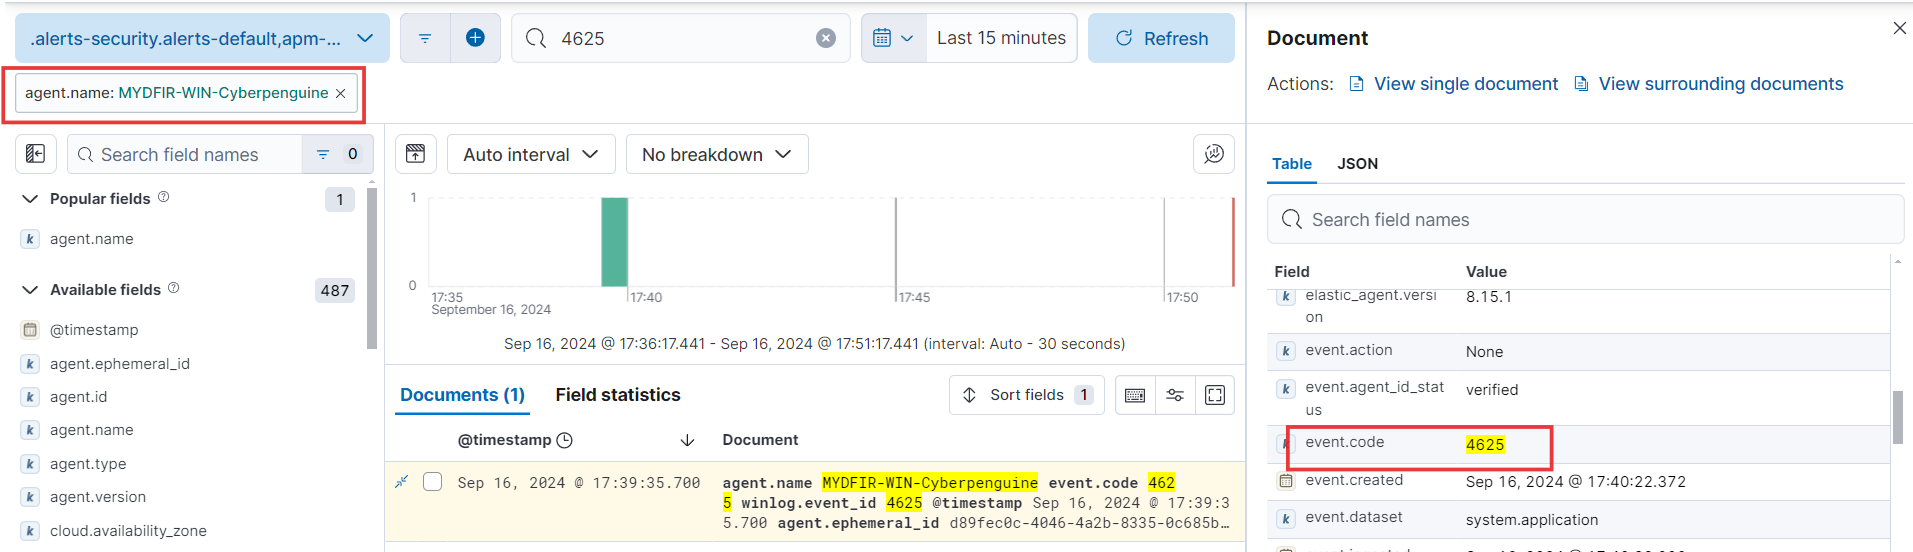
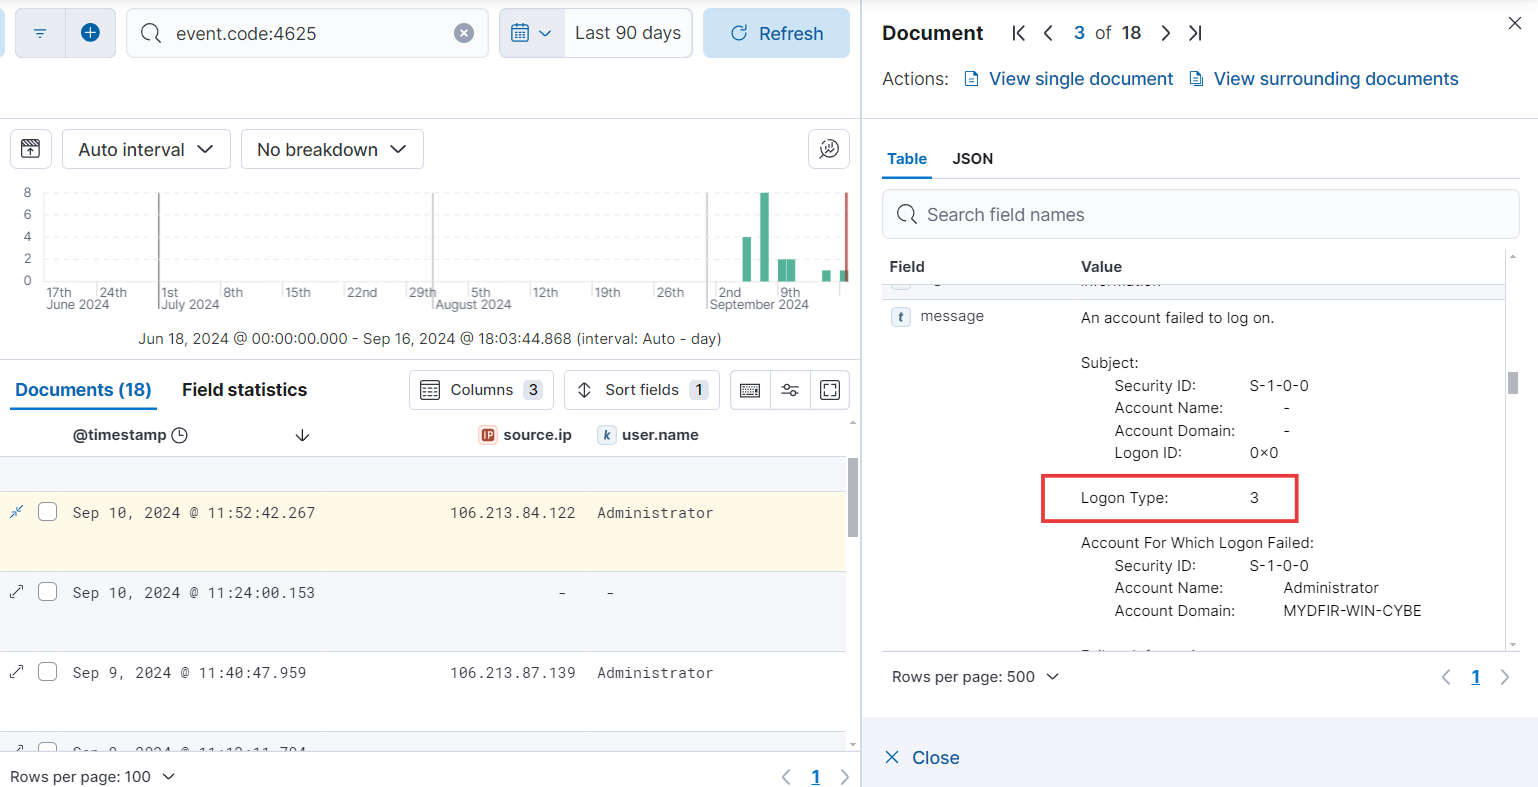
- Let’s craft a query to filter out only the logs related to failed authentication, making it easier to pinpoint security incidents.
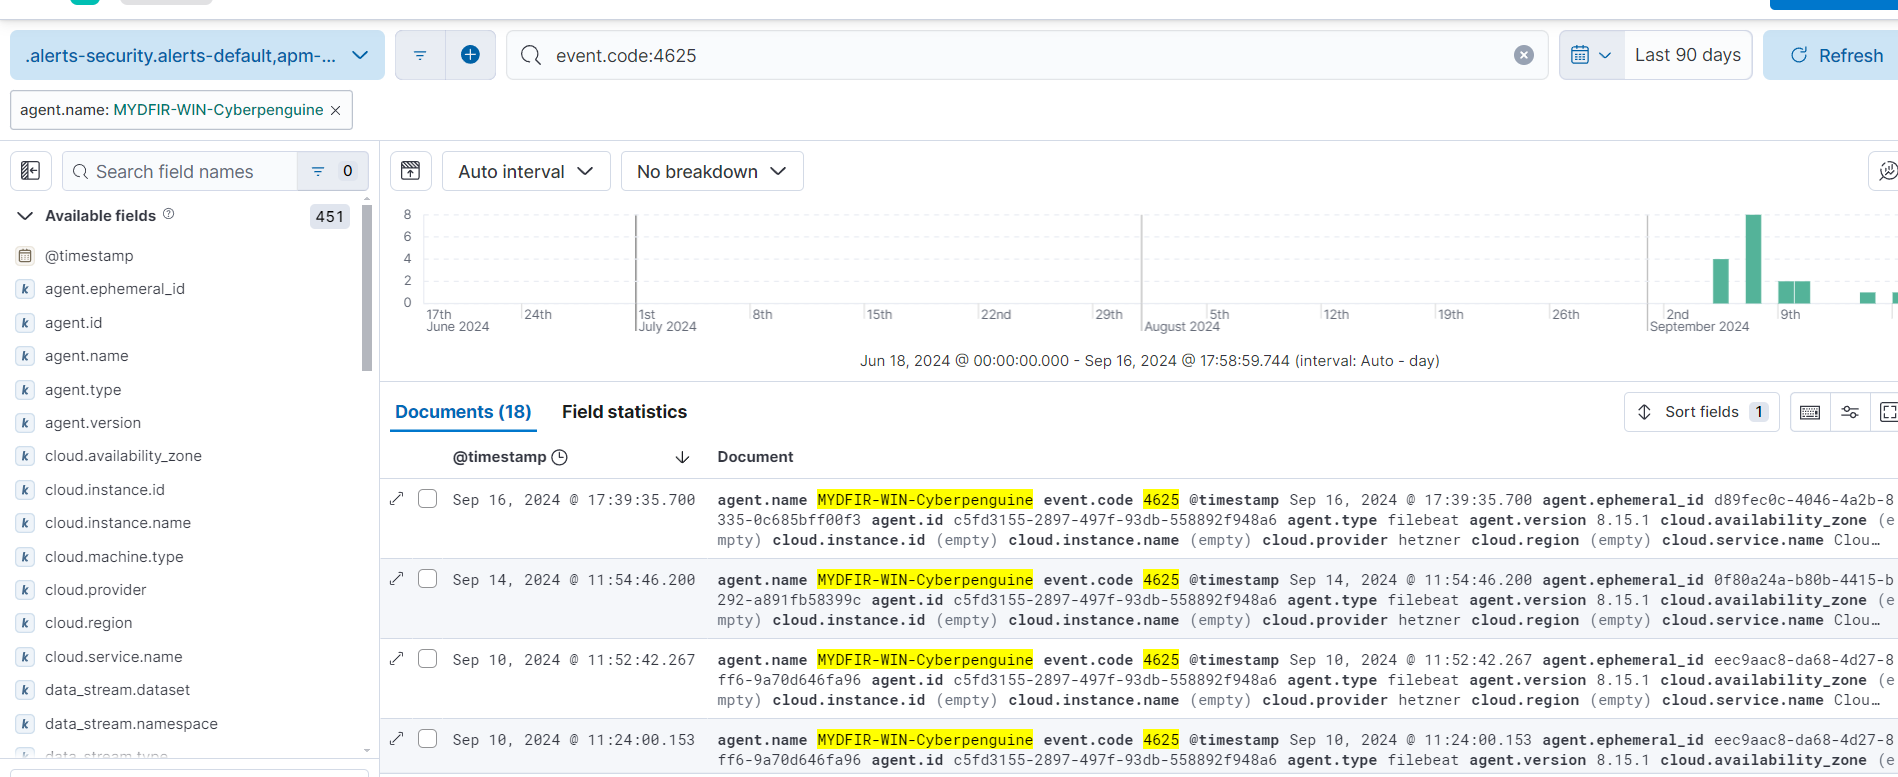
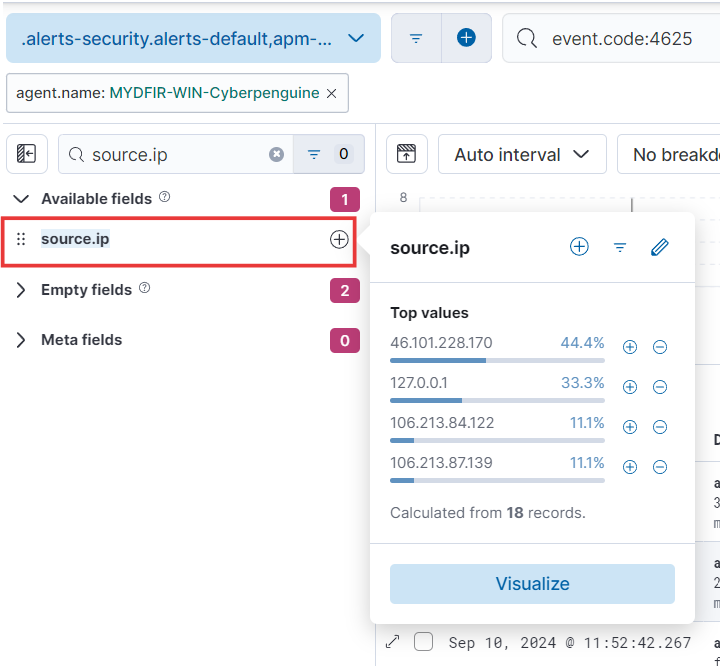
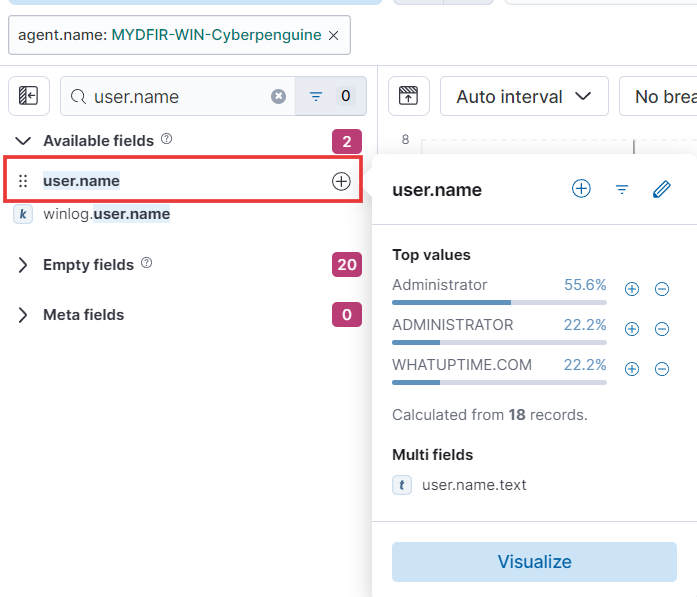
- I’ve added source IP address and username as essential fields. Want to focus on something else? Feel free to add more columns that pique your interest. Let’s make this table a powerhouse of information!
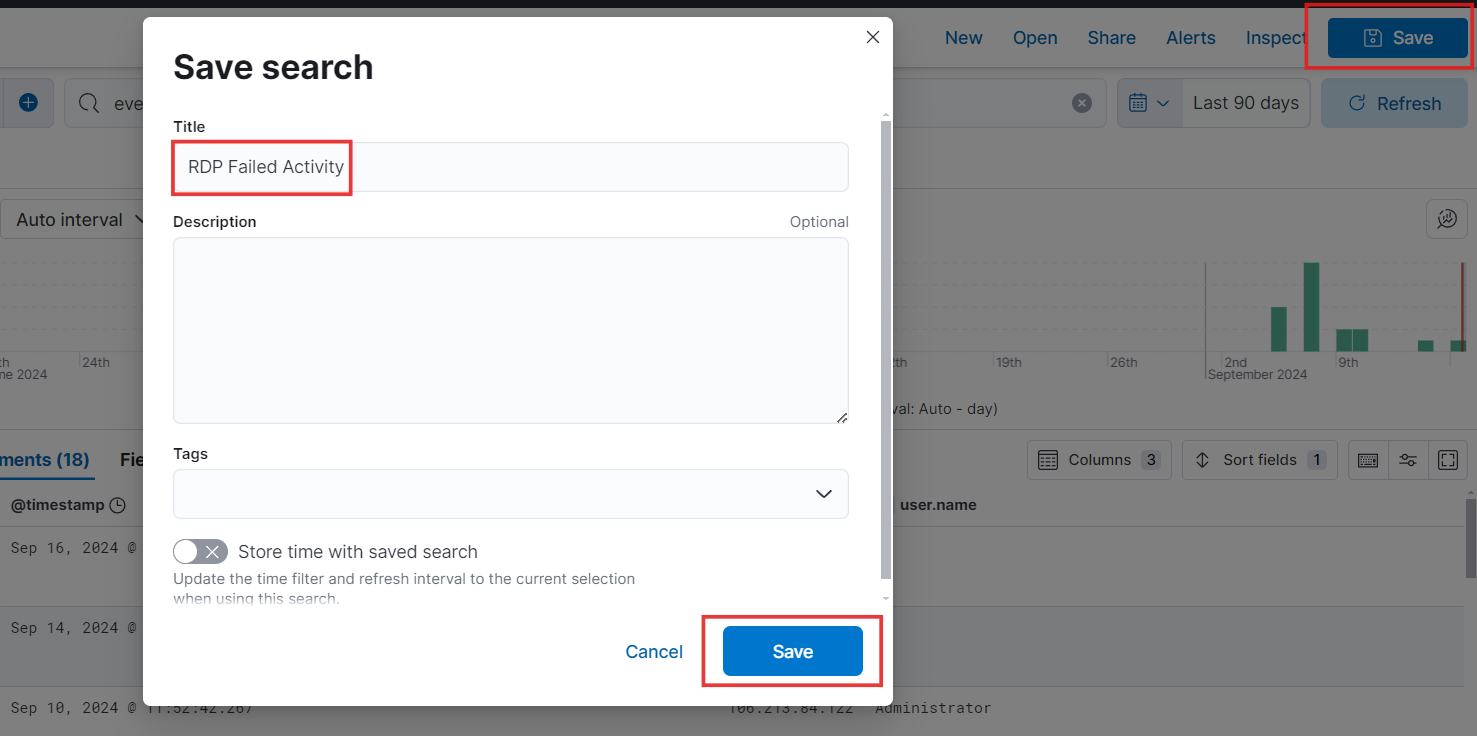
- We’ve added the filters and columns you need. Now, let’s save this search for easy access later!
- If we expand the alert, in the message field, you’ll see ‘Logon Type 3.’ According to Windows event ID documentation, this indicates a network connection. So, how can we determine if it’s a failed RDP authentication attempt?
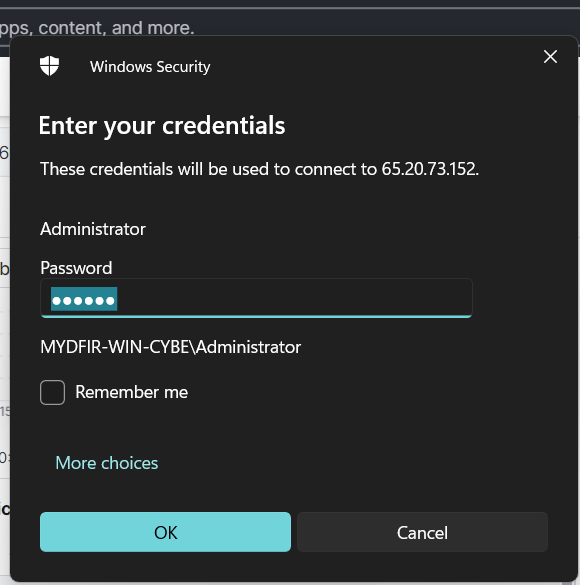
- Let’s dive into the details! To confirm, let’s try logging into the Win server using RDP. As you can see, a new notification is also indicating a logon type of 3. For successful logon types, the event ID documentation provides a list of relevant identifiers.
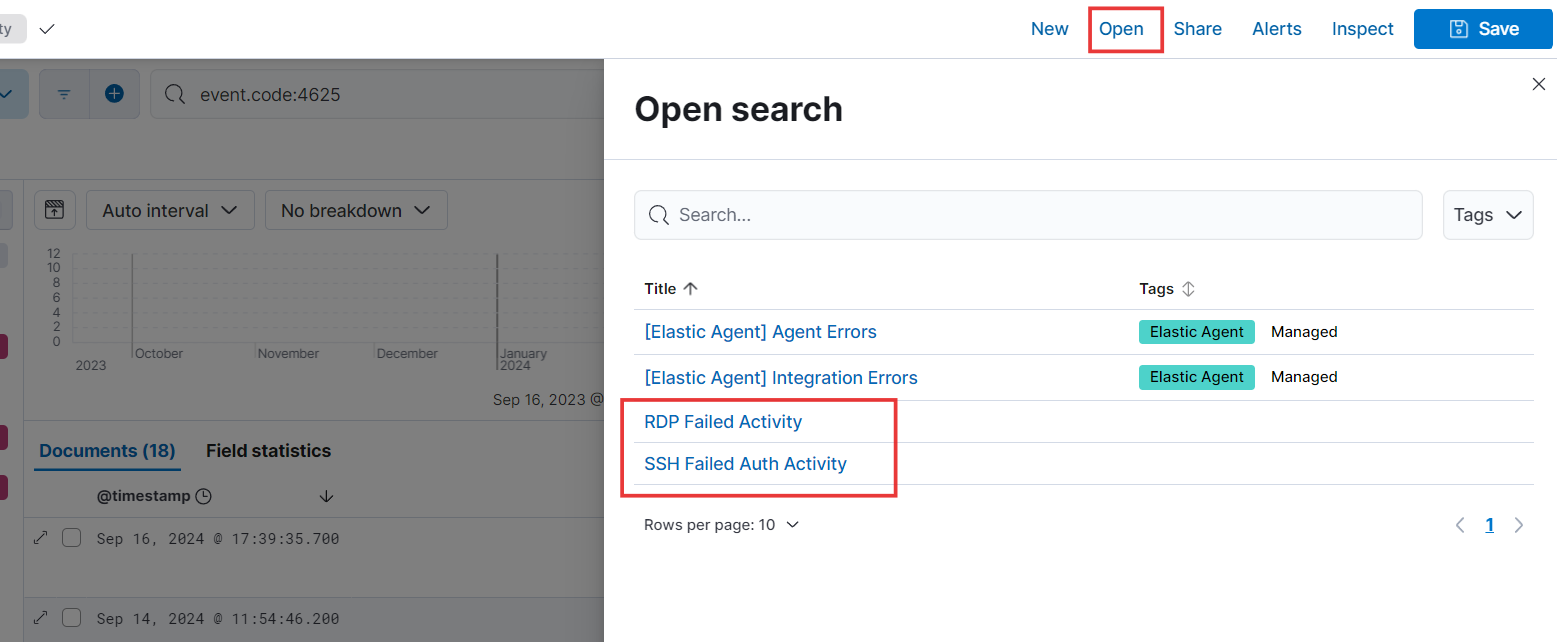
- Let’s check out the saved searches in the Open tab.
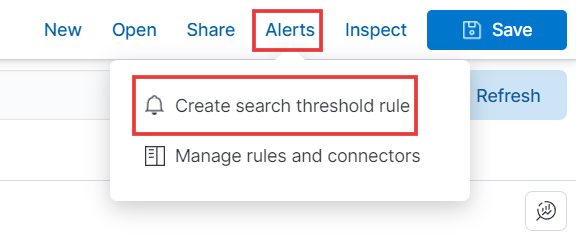
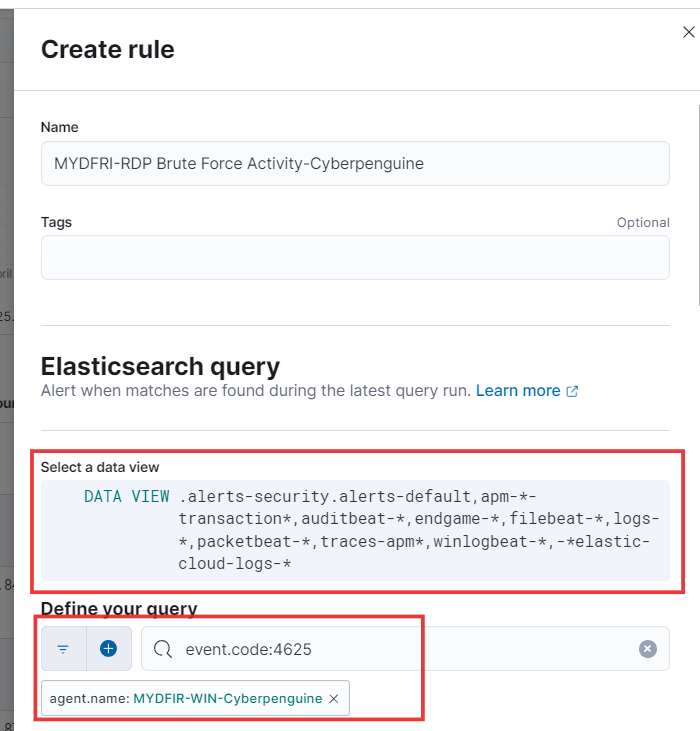
- To create an alert for your search, click the “Alert” tab, give your alert a memorable name, and review the “Data View” and “KQL query” - they’re the same as the ones you used for your search.
- For this demo, let’s set the following fields:
- Every minute, it will check the query and, if it matches, save the alert. With these settings, you’ll be notified promptly of any potential issues.

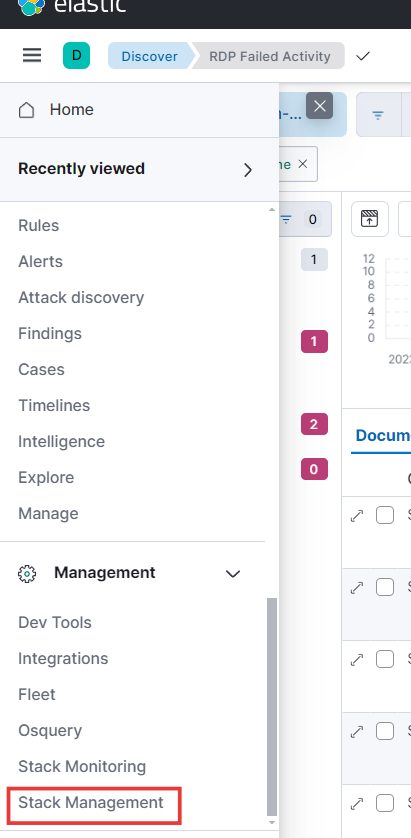
- The alert we created isn’t very informative. However, we can create rules for SSH and RDP failed authentication logs to get more details. Let’s also check if other alerts are providing valuable insights. Head over to Management in the hamburger menu and select Stack Management.
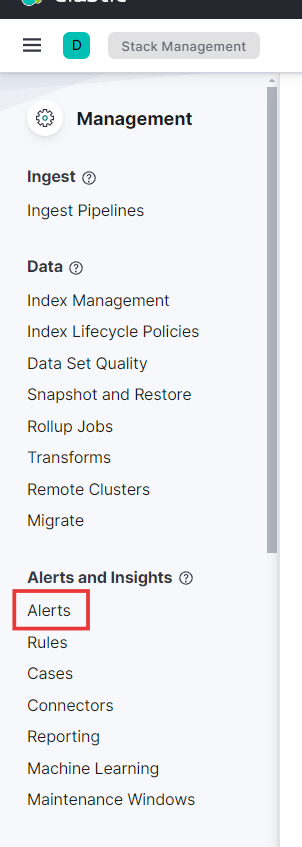
- Let’s dive into the Alerts section under Alerts and Insights. Here, we’ll see that, similar to the search alerts, the information provided is quite limited.
- Now, let’s create a rule. To do this, go to the Security option in the hamburger menu and select Rules under Security.
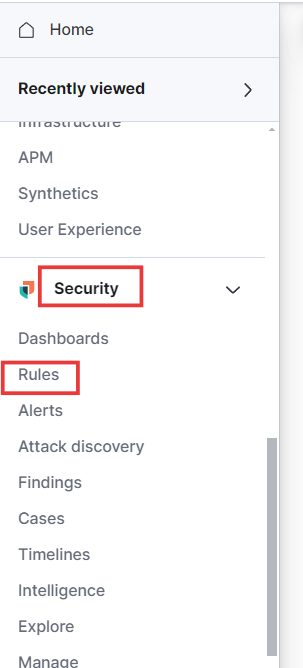
We’ll be presented with several options, and to create a rule, we’ll choose the first one:
Detection rules (SIEM)
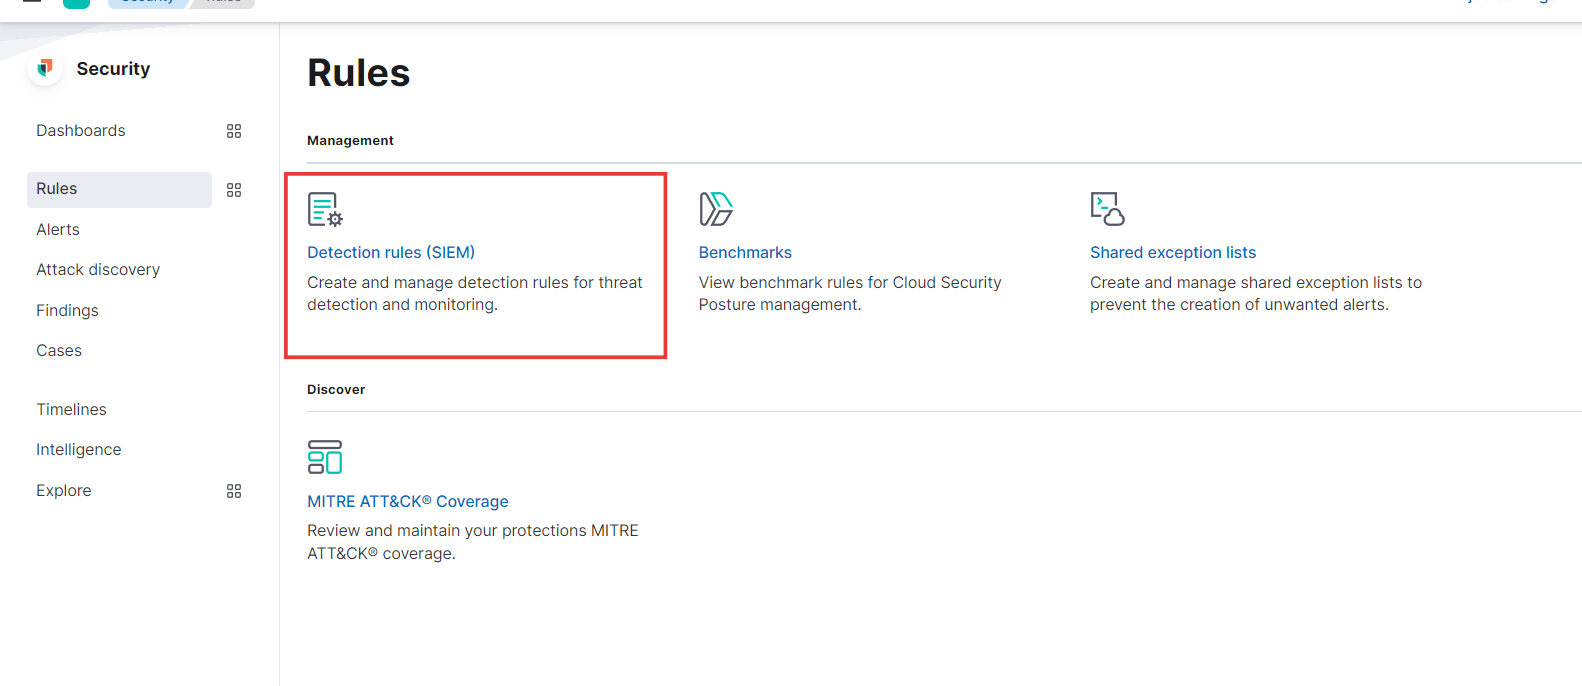
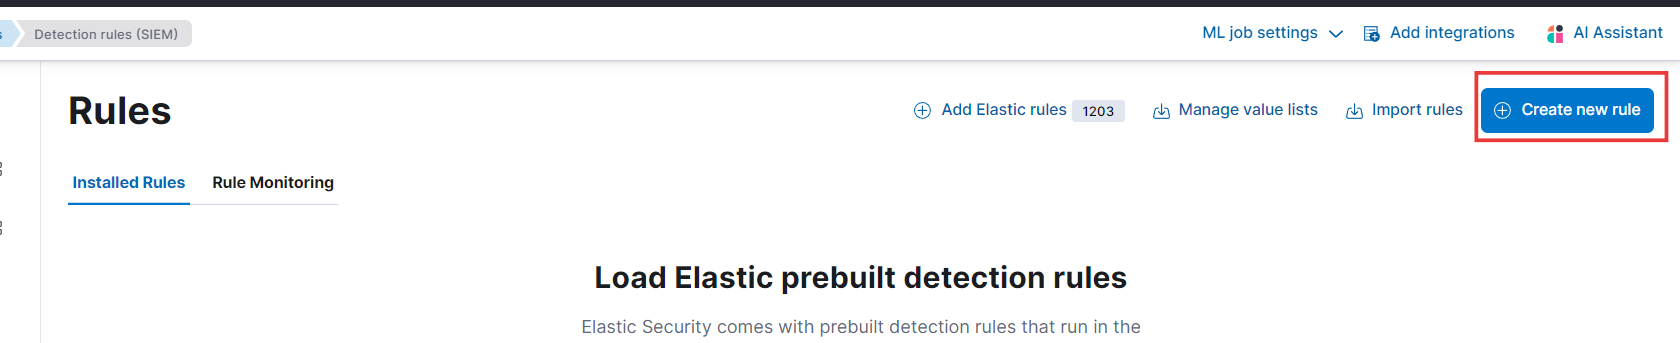
- On next page, click on Create new rule button.
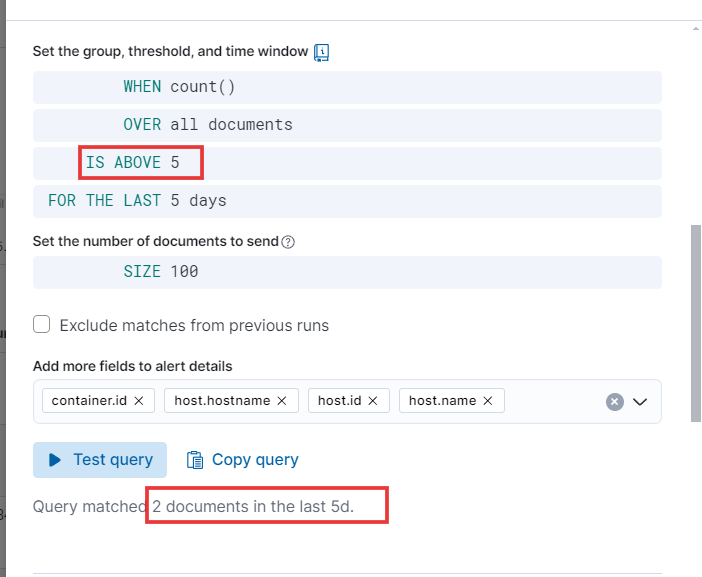
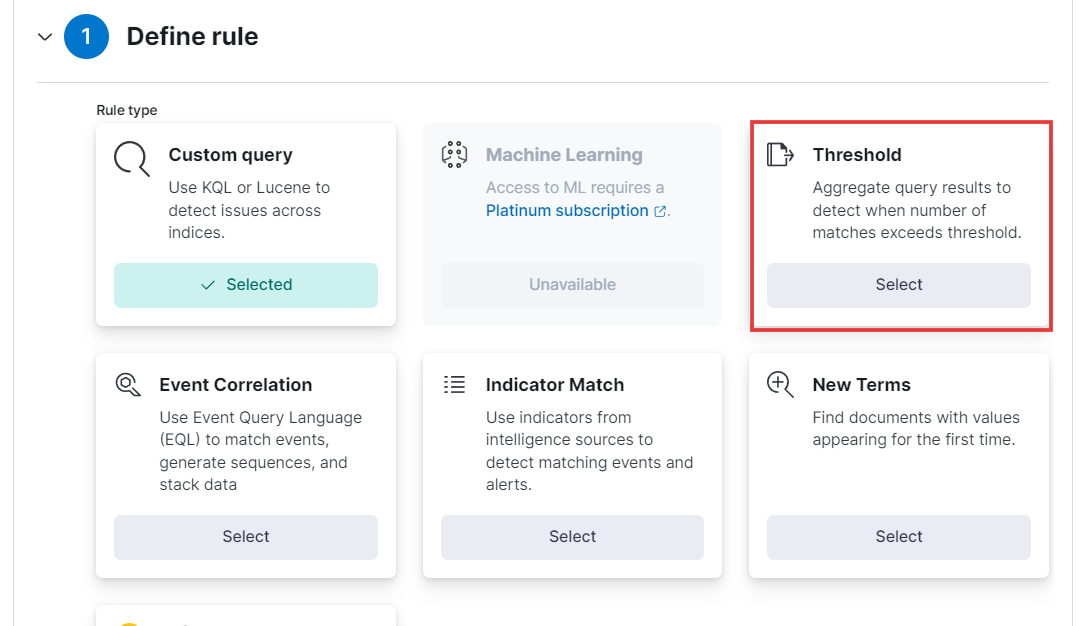
- To define the rule, select the Threshold option, just like we do for our alerts.
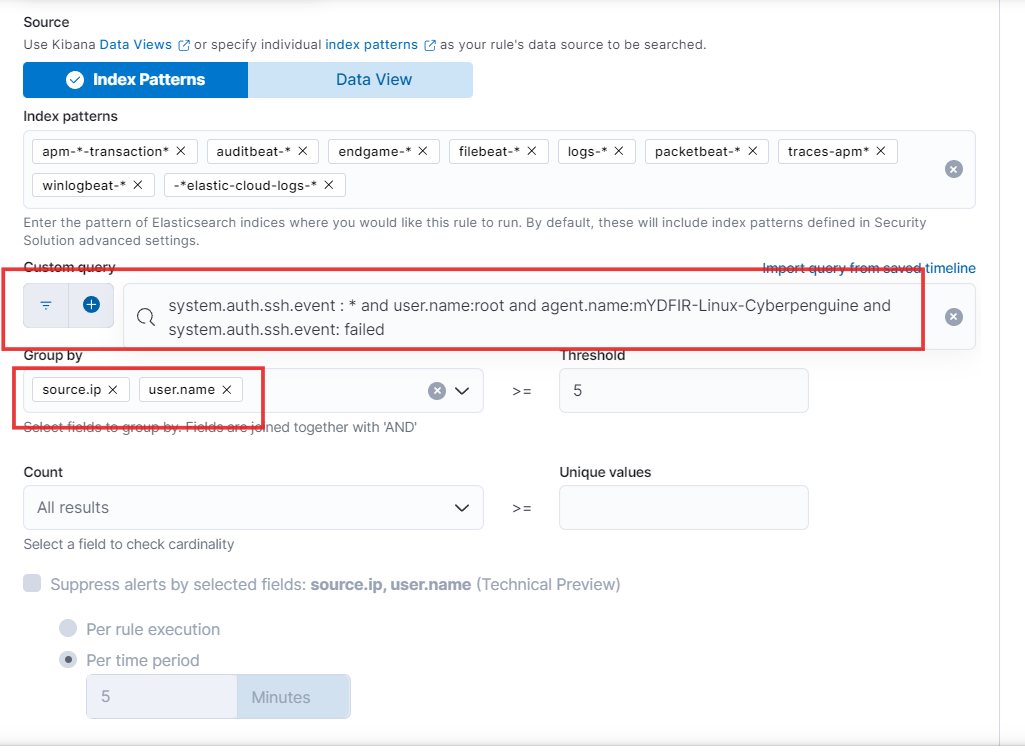
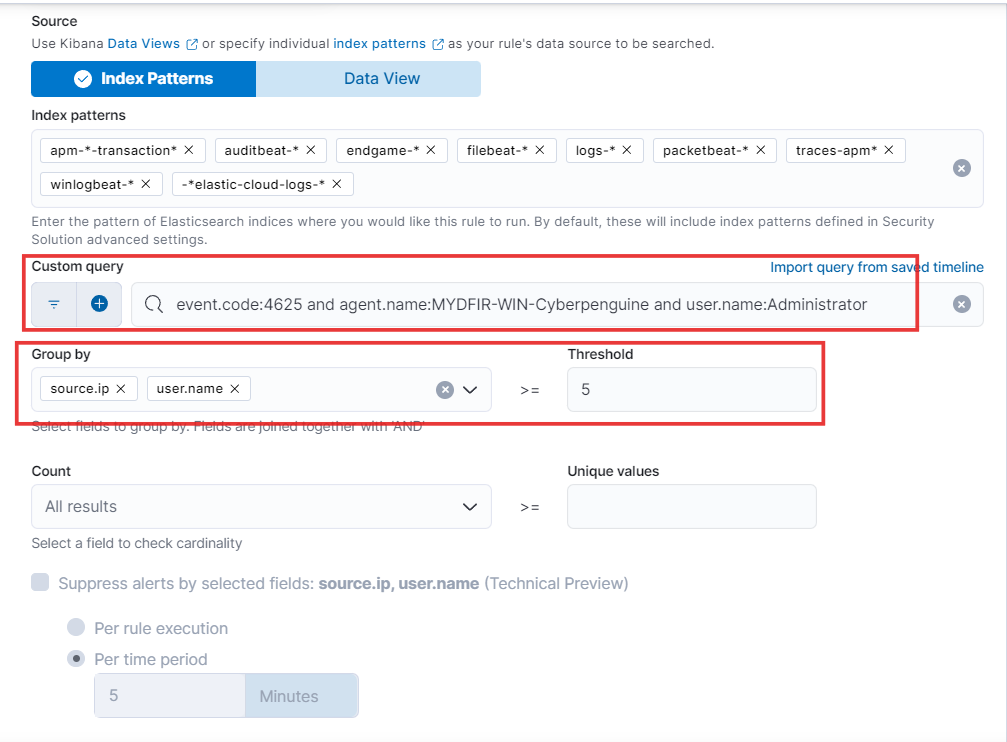
To analyze SSH authentication logs for suspicious activity on your Ubuntu server, we’ll use the Index Patterns you’ve already created. We’ll stick with the default fields in your index patterns for simplicity.
Now, let’s get specific! Paste the custom query you created on Day 14 for SSH authentication logs. To identify potential brute force attempts, we’ll group the results by
source.ip(the IP address attempting login) anduser.name(the username being targeted).Finally, to focus on potentially risky activities, we’ll only consider IP addresses with more than or equal to 5 failed login attempts.
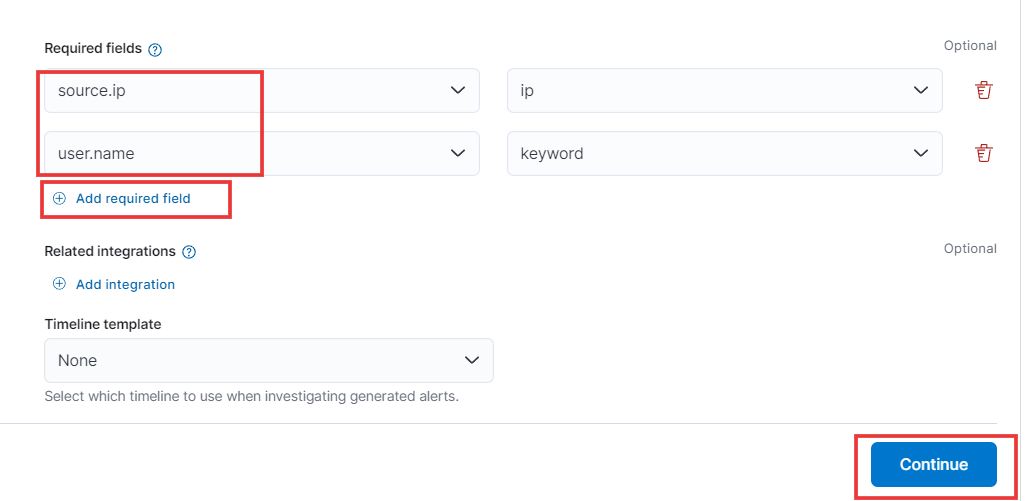
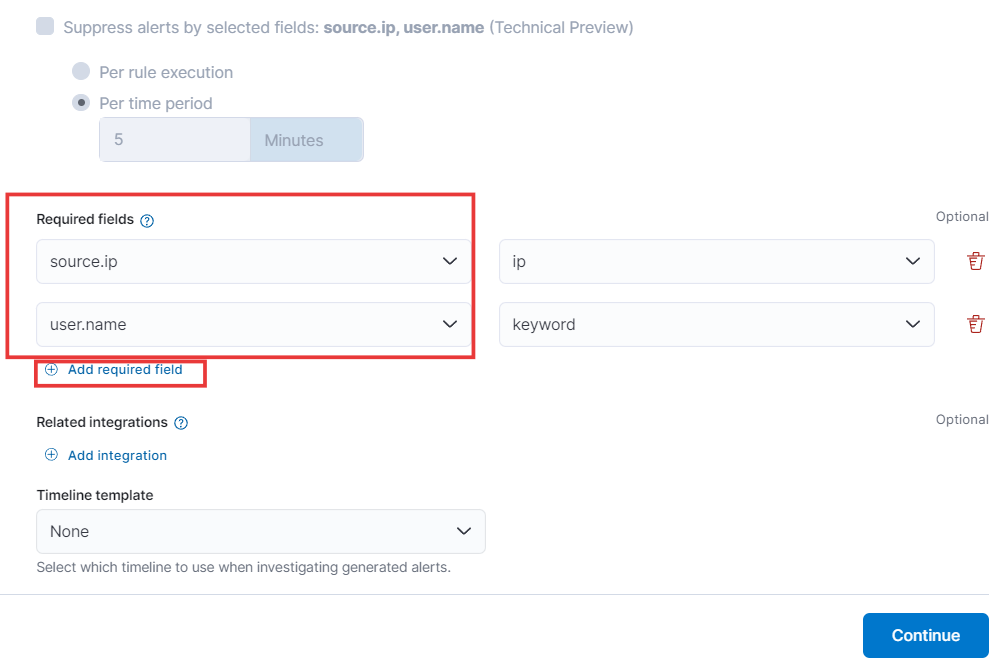
Want to streamline adding required fields? Here’s how:
By default, all fields are optional. But you can easily make specific ones mandatory. Just click the plus button (+), and a new field creation window will appear. Here, add the field names you want to be required, like “Source IP” and “User Name”. Then, click Continue to finalize and make these fields mandatory.
That’s it! Now, users won’t be able to submit forms without filling out these crucial details. Need to add more required fields? Simply repeat this process.
Have questions about customizing required fields? Drop a comment below on my linkedin or twitter inbox I’ll be glad to help!
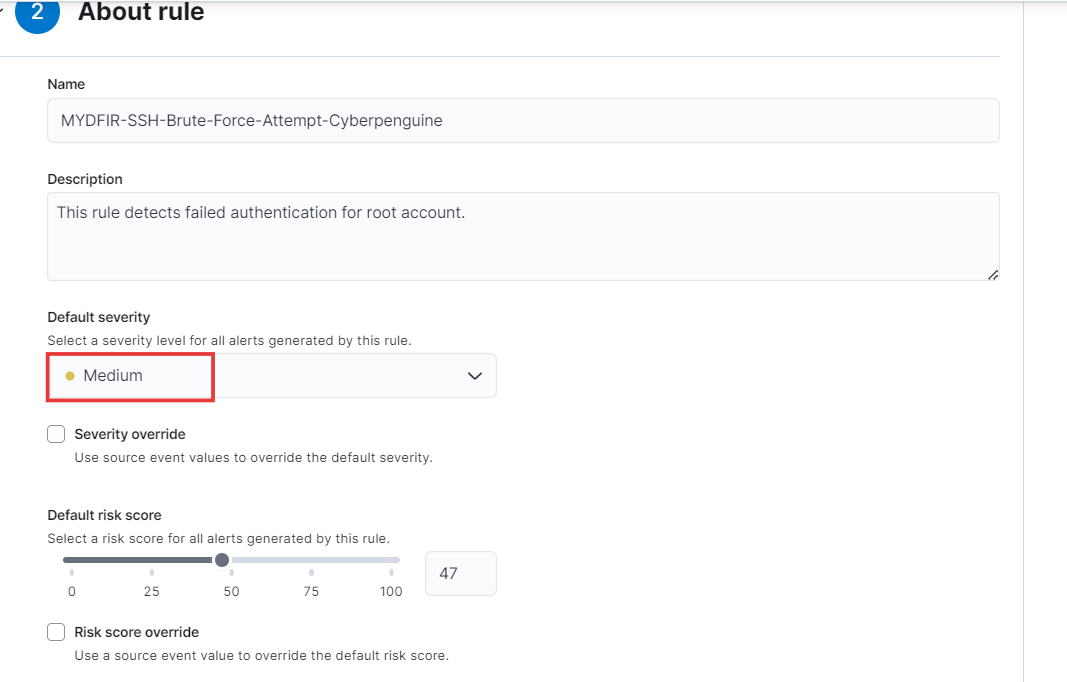
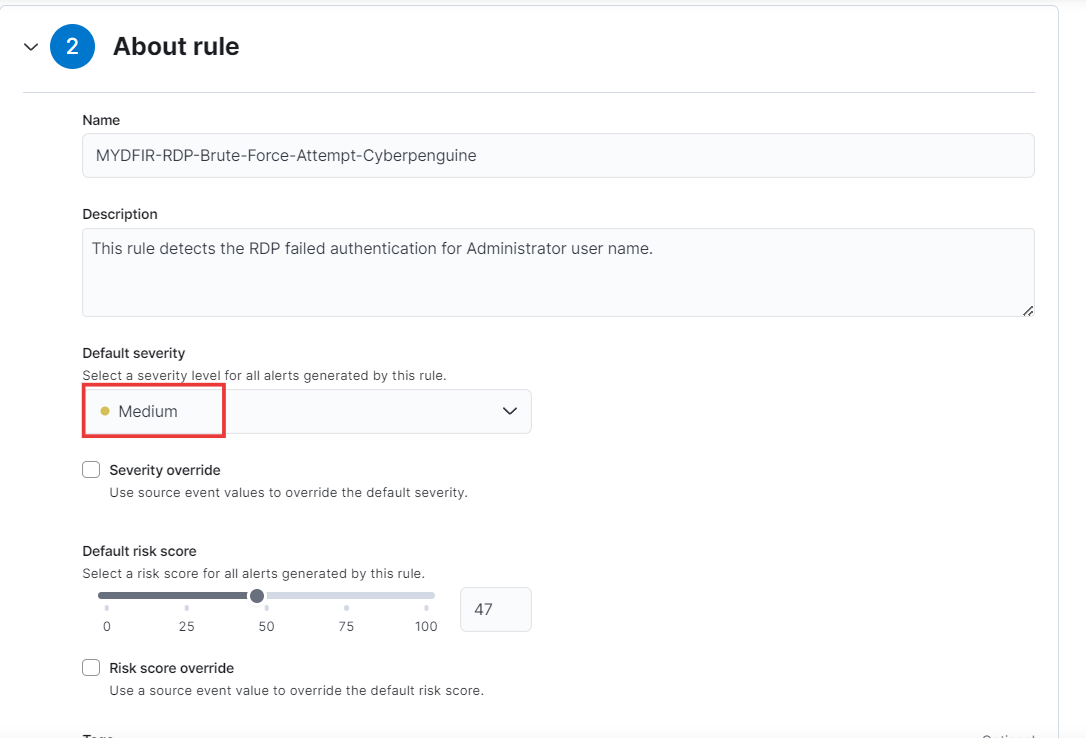
Give rule name suitable for this rule and for description:
Description: Detects unusual patterns of login attempts from a single IP address within a short timeframe. This could indicate a potential brute force attack or compromised credentials.
Severity Level: Medium
Additional Notes:
- Consider adjusting the severity level to High if the rule detects a large number of failed login attempts from a known malicious IP address.
- You may want to refine the rule further by specifying a specific timeframe for login attempts or excluding certain IP addresses (e.g., internal networks).
- Consider integrating this rule with other security measures, such as password complexity requirements and multi-factor authentication.
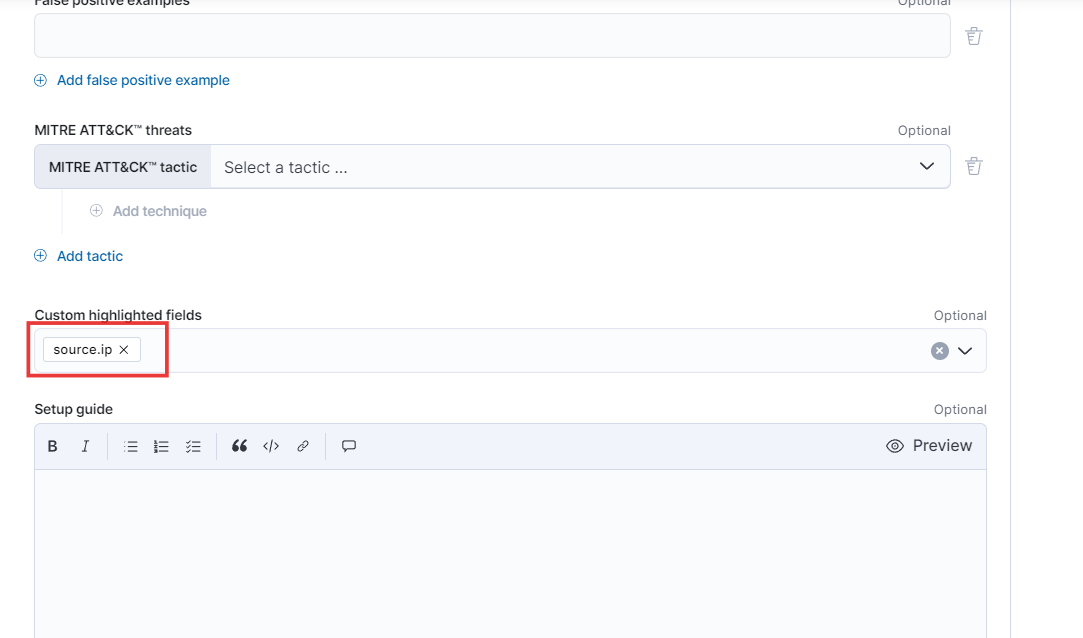
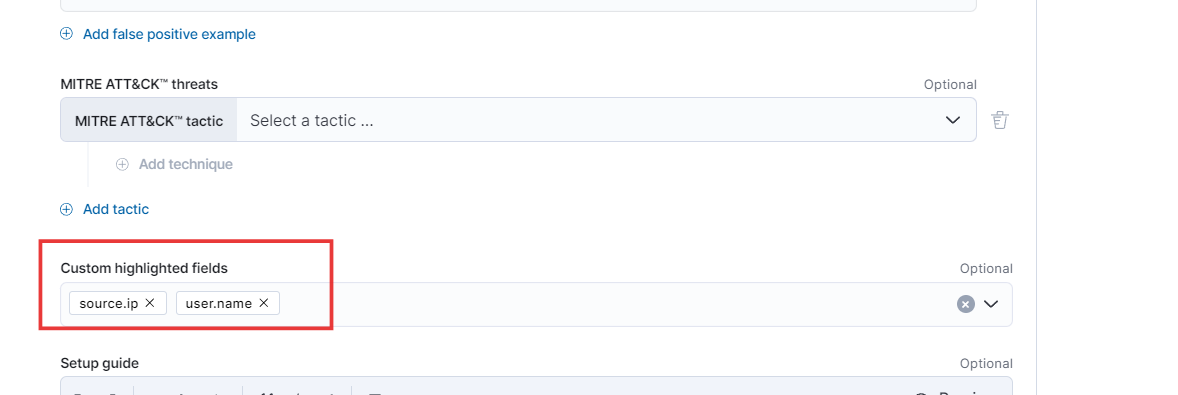
- While keeping all other fields unchanged, we’ll add the custom highlighted fields ‘source.ip’ and ‘Continue’ for enhanced analysis.
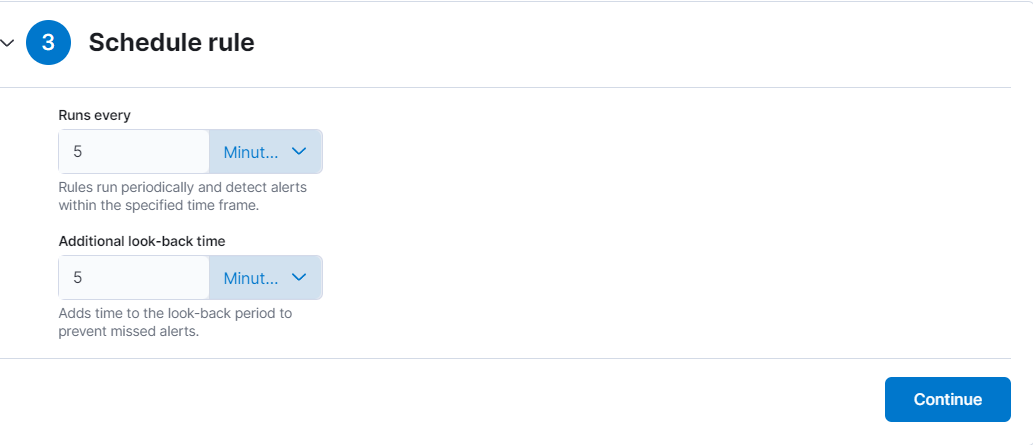
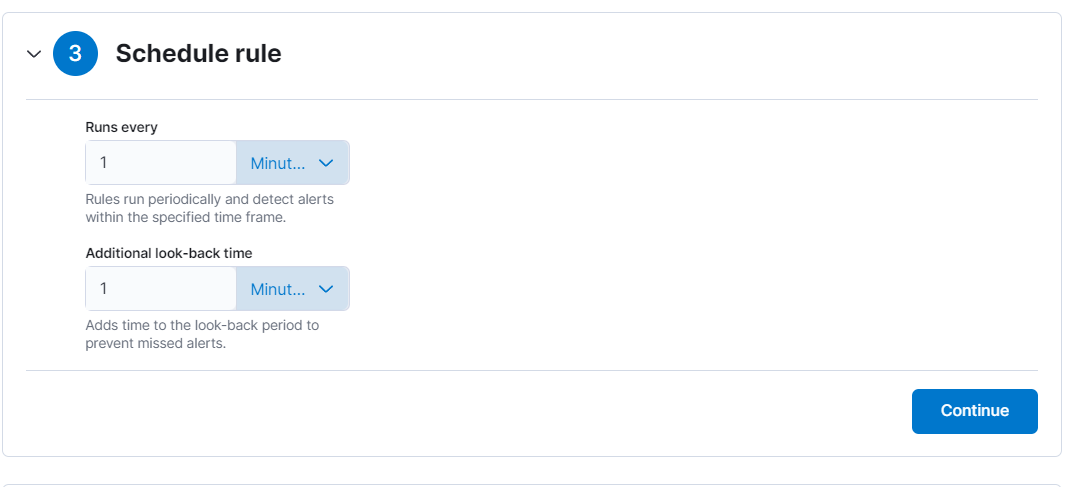
- To schedule the rule, set the query to run every 5 minutes and adjust the additional lookback time to 5 minutes. Then, proceed.
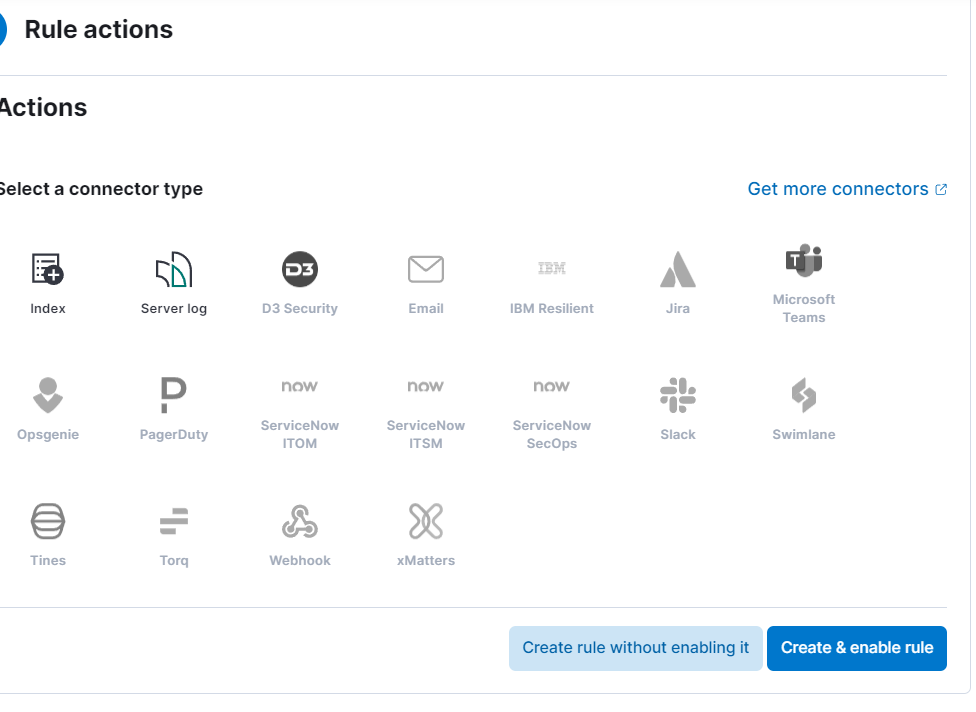
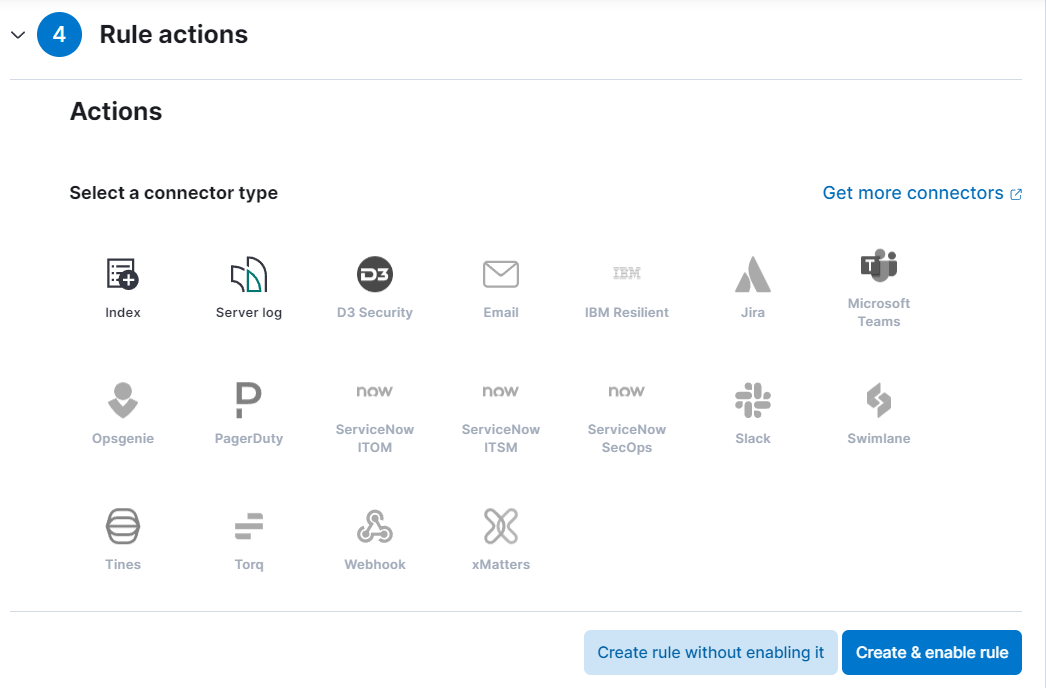
- Let’s keep the default settings for rule actions and create a new rule. Don’t forget to enable it once you’re done!
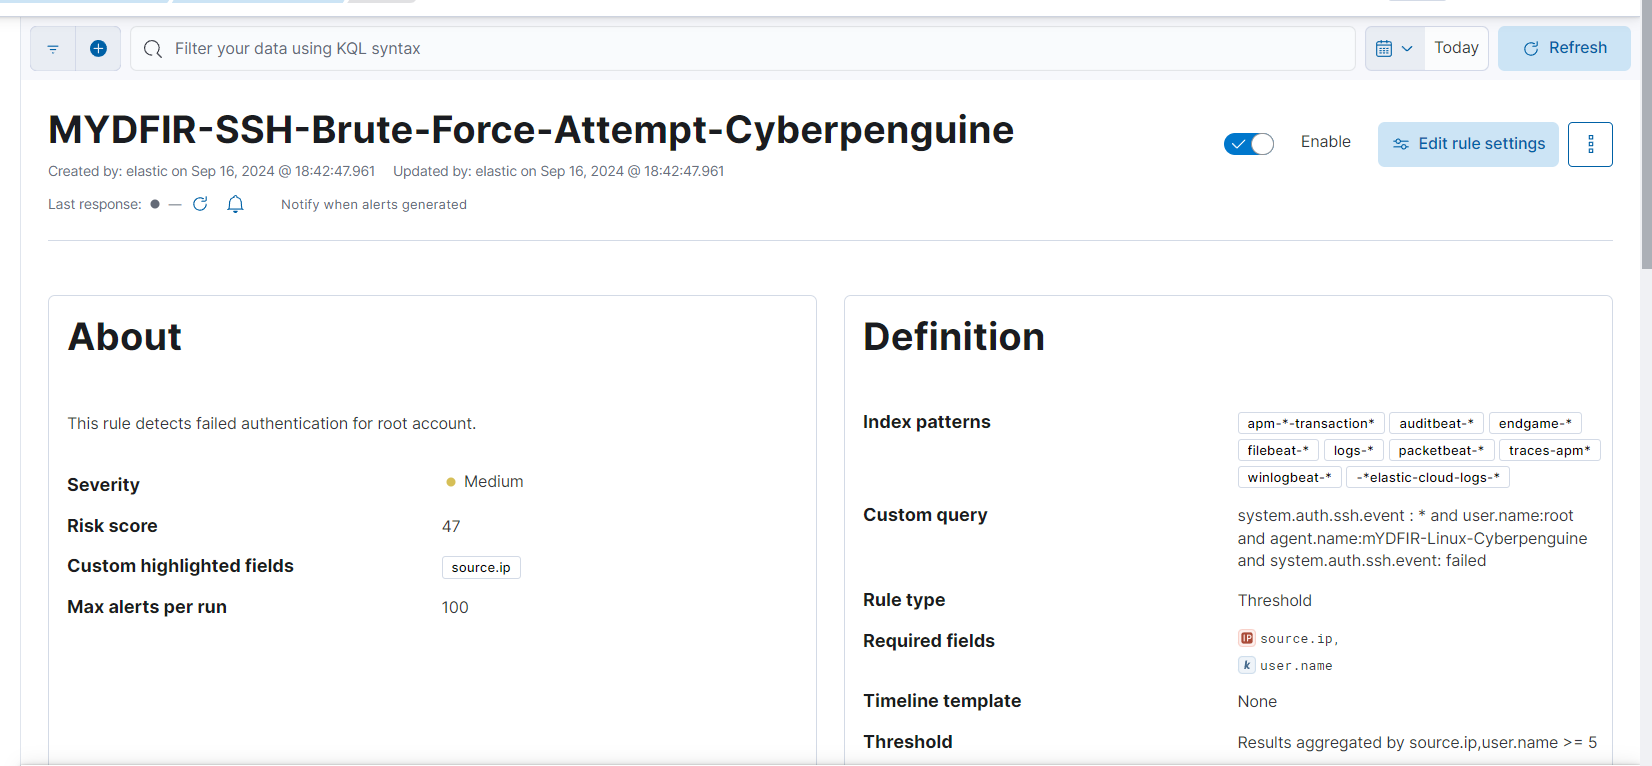
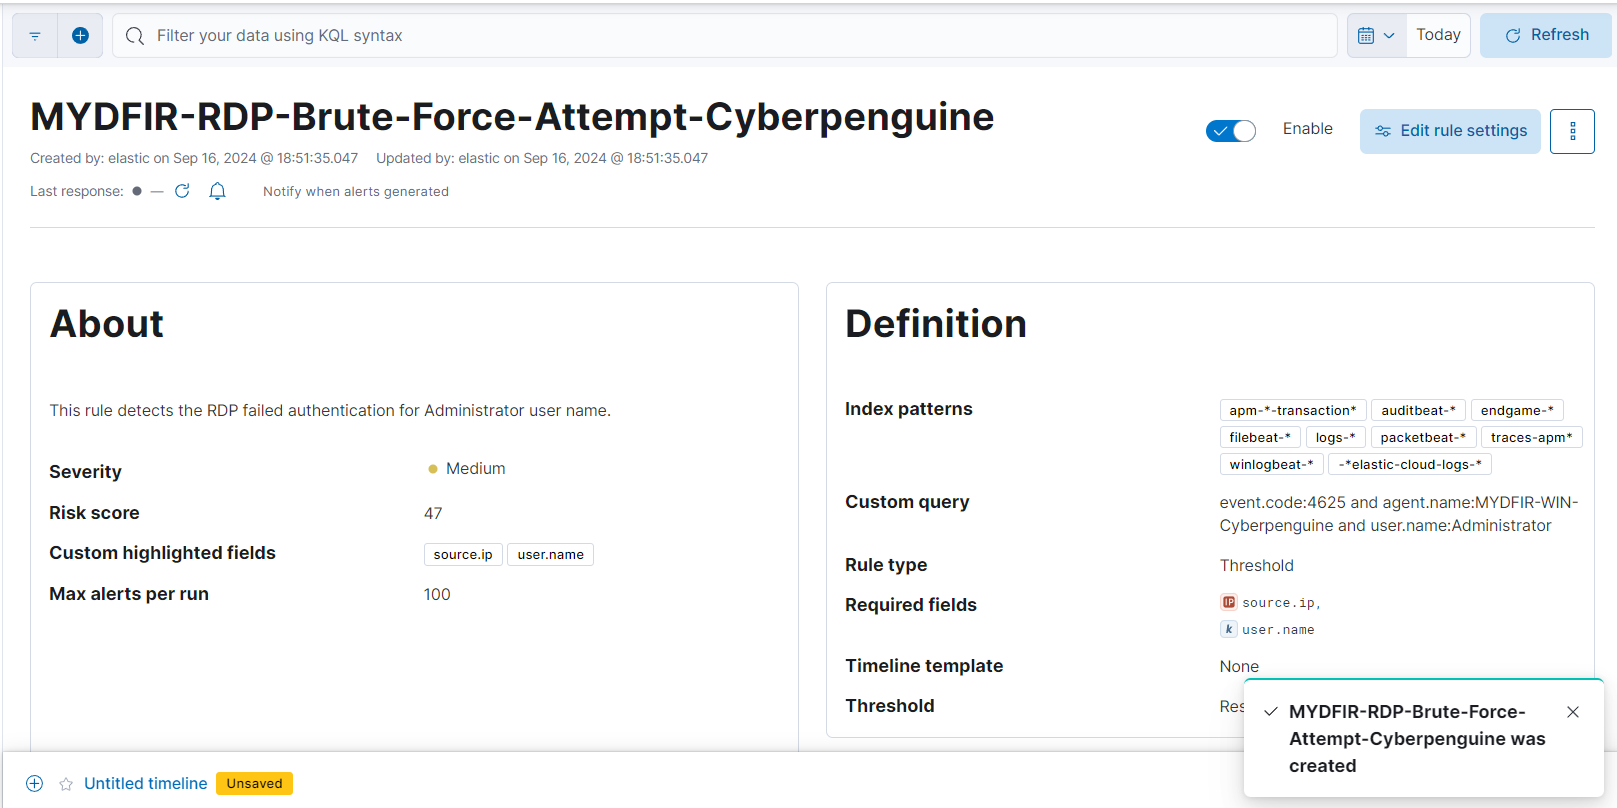
- And our rule is created for SSH brute force attempt.
- Let’s tackle RDP brute force attempts together! We’ll follow the same steps we used before, so you can try this on your own. If you get stuck, don’t hesitate to share your screenshots, and I’ll be happy to help.
We’re cooking up some new rules that’ll give us a sneak peek into alerts when we unleash our brute force attacks on servers in future blogs. But hey, remember that dashboard we haven’t built yet for RDP failed authentication attempts? That’s next on the agenda. So, stay tuned, and let’s keep learning together in this exciting SOC Challenge!