Day-2 ELK Stack Introduction
ELK: The Data Detective’s Ultimate Tool
Imagine you’re a detective on a quest to solve a complex mystery, but instead of clues, you’re faced with a mountain of digital data. That’s where ELK (Elasticsearch, Logstash, Kibana) comes in—your indispensable sidekick in cracking the case. Think of ELK as your personal detective squad, ready to investigate, analyze, and reveal the hidden insights within your data.
What’s in the Name?
- Elasticsearch: The mastermind of the operation. This is where all your data is stored and analyzed. Picture it as a highly skilled detective, capable of sifting through massive amounts of information to find that elusive needle in the haystack.
- Logstash: The data collector. It gathers information from various sources and prepares it for analysis in Elasticsearch. Imagine Logstash as your detective’s trusty partner, gathering all the critical evidence.
- Kibana: The visualizer. It presents data in a clear, understandable format. Think of Kibana as the detective’s whiteboard, helping piece together the clues and revealing the bigger picture.
Elasticsearch: The Sherlock Holmes of Data
- ESQL: This is the detective’s secret language. It’s how you instruct Elasticsearch to search for specific information. Consider it the data equivalent of interrogation techniques.
- RESTful API and JSON: These are the tools Elasticsearch uses to interact with other applications. They’re like the detective’s gadget-filled toolkit, essential for solving the case.
Logstash: The Watson to Elasticsearch’s Sherlock
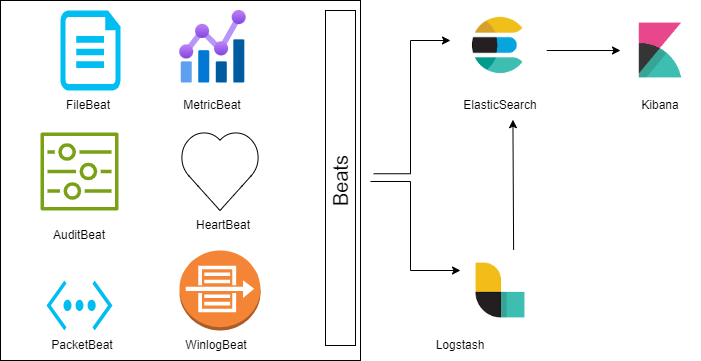
- Beats: These are like the detective’s informants, gathering data from various sources such as servers, networks, and applications. There are six types of Beats:
- Filebeat: A lightweight log shipper that collects data from files or logs. It’s part of the Beats family and is less resource-intensive than Logstash. It uses a backpressure-sensitive protocol to handle higher volumes of data.
- Metricbeat: Collects and reports system-level metrics for various platforms and systems.
- Auditbeat: Monitors file integrity and collects audit framework data, shipping events in real-time for further analysis.
- Heartbeat: A lightweight shipper for uptime monitoring.
- Packetbeat: Analyzes network packets, capturing traffic between servers for application and performance monitoring.
- Winlogbeat: Fetches and ships Windows Event logs.
- Agents: Think of these as the detective’s assistants, collecting data from various sources and sending it to Logstash. They act as a team of investigators working together to gather evidence.
Kibana: The Visual Detective
- ESQL: The Elasticsearch Query Language used to query data and obtain the filtered results for investigation.
- Lenses: These are like the detective’s magnifying glass, allowing you to visualize your data in diverse formats such as charts, graphs, and maps. It’s like viewing clues from a new perspective.
Why Choose ELK?
- Centralized Logging: Consolidates all your data in one place for easier access and analysis.
- Flexibility: Suitable for a wide range of applications, from security to business analytics.
- Visualization: Transforms data into understandable and shareable insights.
- Scalability: Handles large volumes of data efficiently.
- Ecosystem: Backed by a large community of developers and users, offering robust support and resources.
ELK vs. Splunk: A Friendly Comparison
- Elasticsearch: Comparable to Splunk’s Indexer/Search Head.
- Logstash: Similar to Splunk’s Heavy Forwarder.
- Kibana: Equivalent to Splunk’s Web GUI.
- Beats/Agents: Comparable to Splunk’s Universal Forwarder.
In summary, ELK is your powerful ally in solving data mysteries. With its detective-like capabilities, it helps uncover the secrets hidden within your data, providing you with insights to crack the case wide open.
This post is licensed under CC BY 4.0 by the author.