Day-22 Mythic Dashboard and Alert in Kibana
In this blog, we will continue our ritual and create the alerts and dashboard for mythic c2.
The alerts will contain the information regarding the process creation, initialization and winodws defender disable alerts.
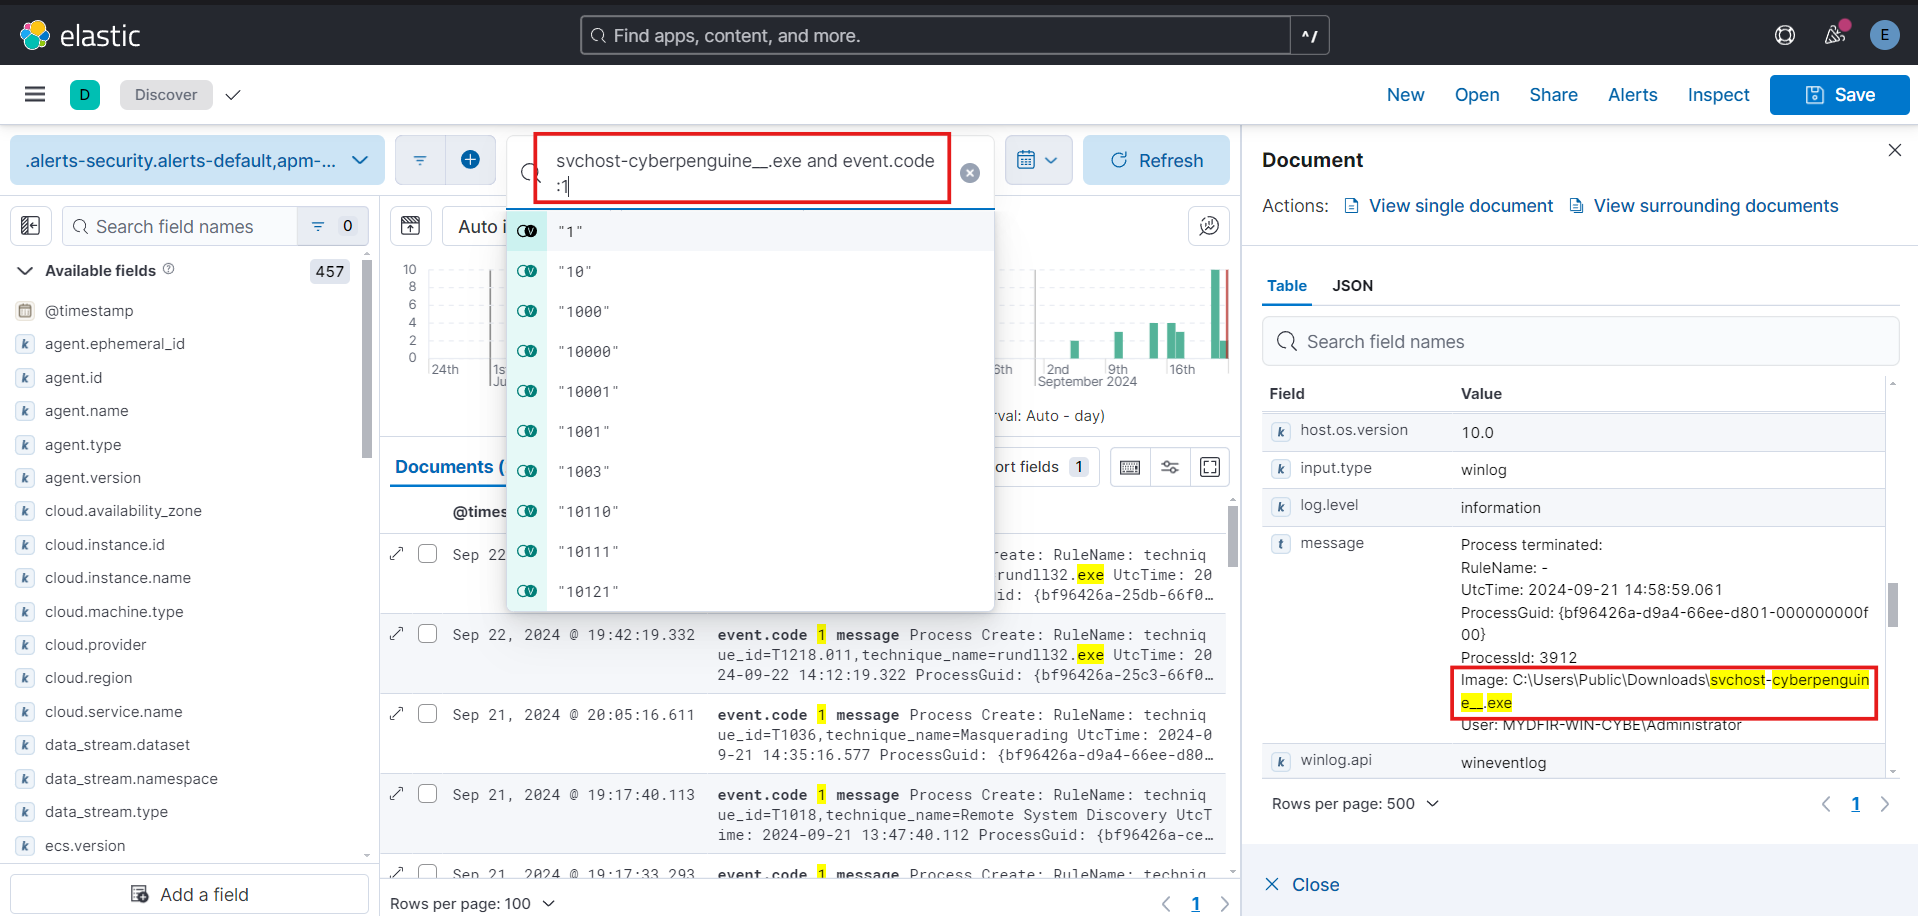
To create the alerts we’ll need to create a suitable query for our first alert.
Create alert for svchost payload file and event code to find the related logs easily and the fields required to us.
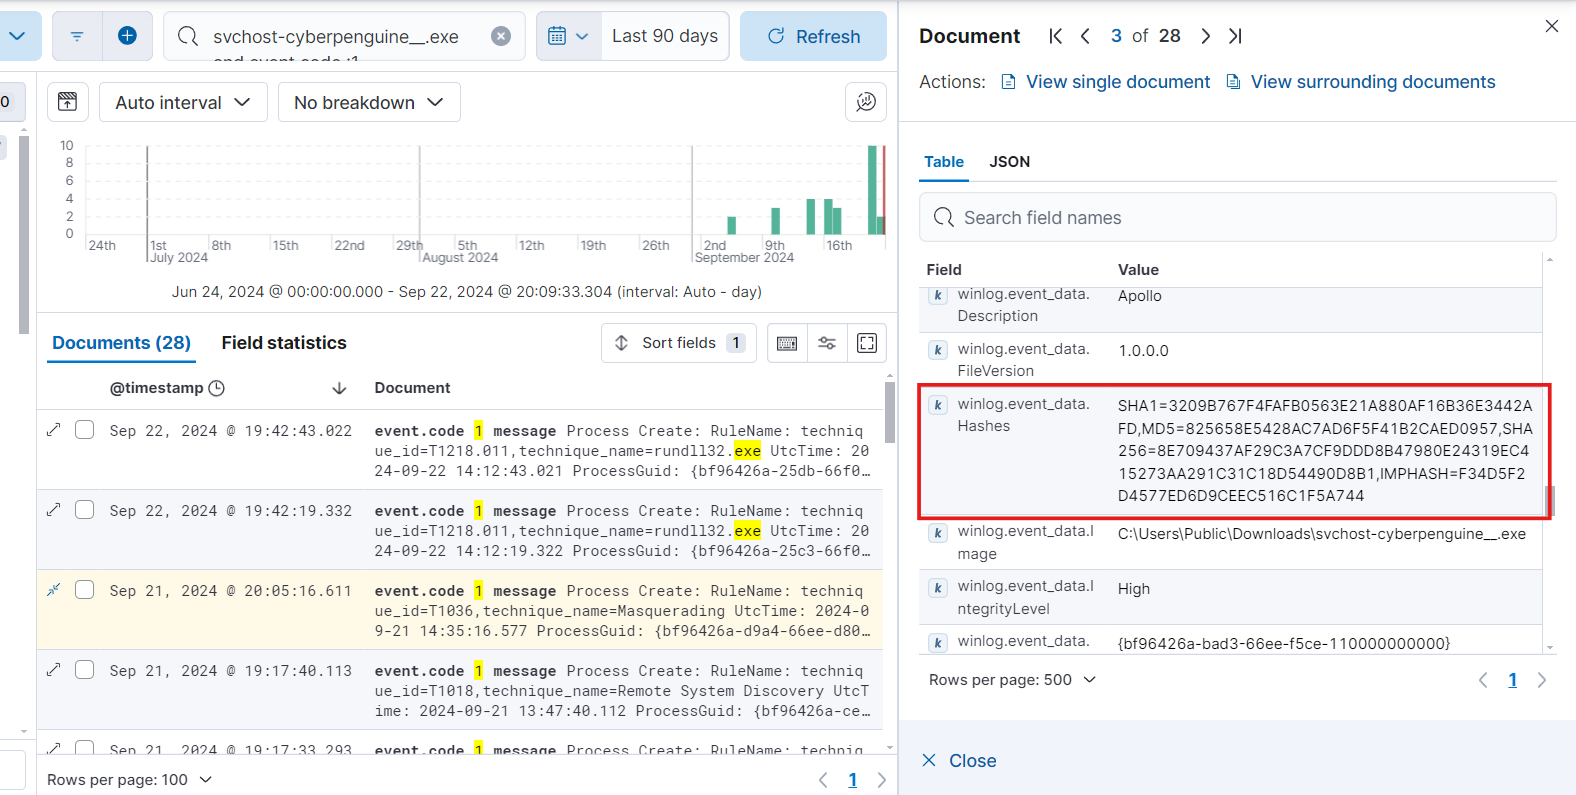
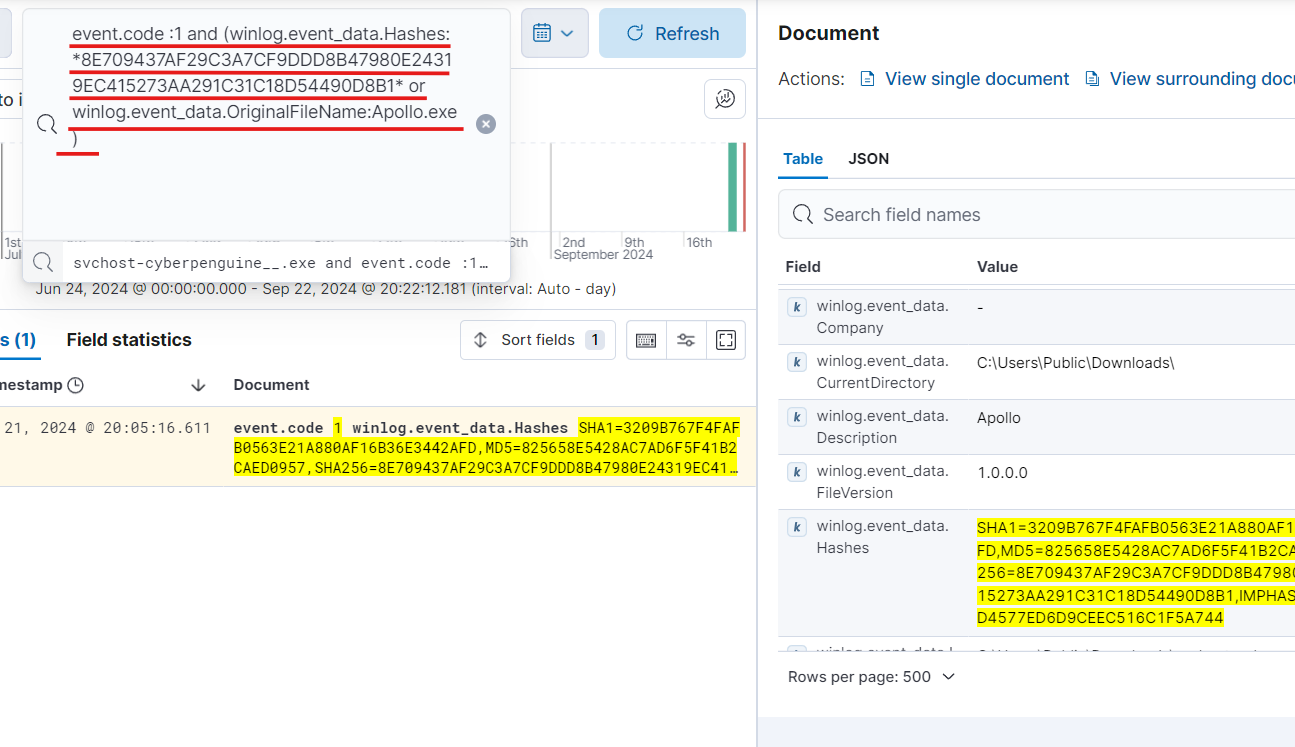
- After updating the query we can expand the log and see the Hash for payload file. Let’s store that hash for further investigations and alert creation.
- We can look into virustotal for any flags against the payload.
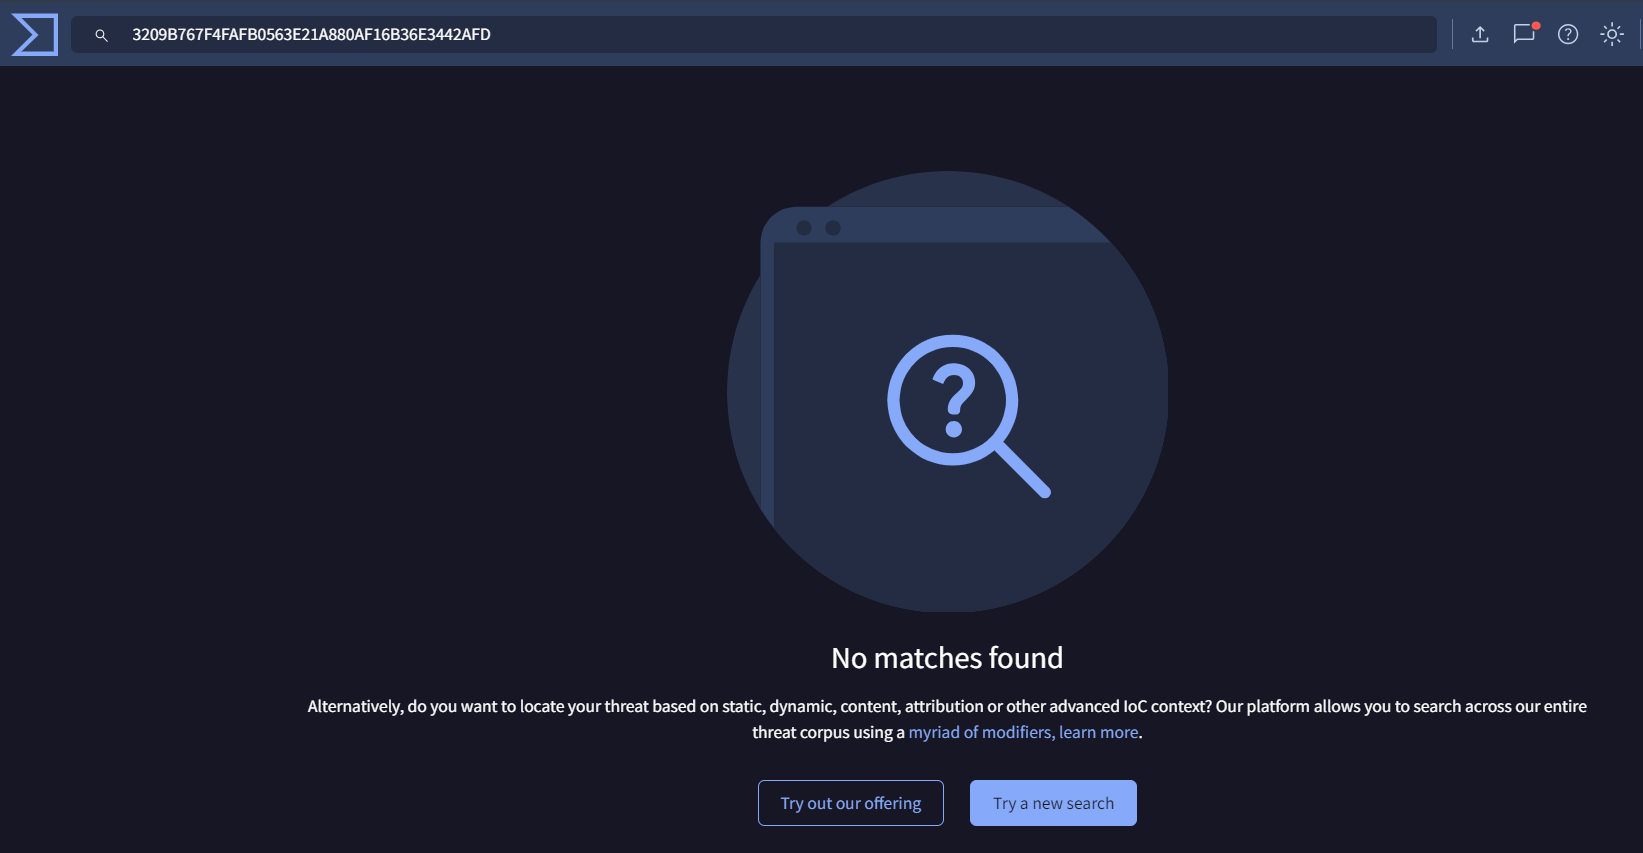
As you can see this hash has no flags as malicious because it is freshly created payload.
If search a little more you’ll see the original filename of payload file in log fields. Let’s tae this field for alert.
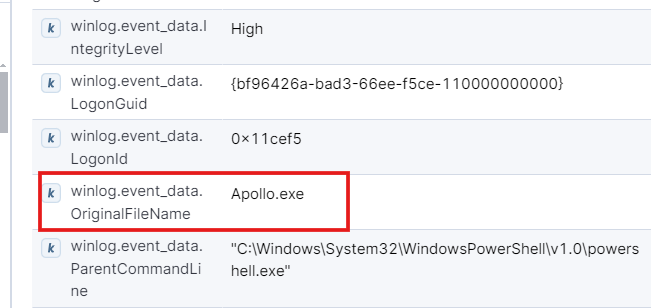
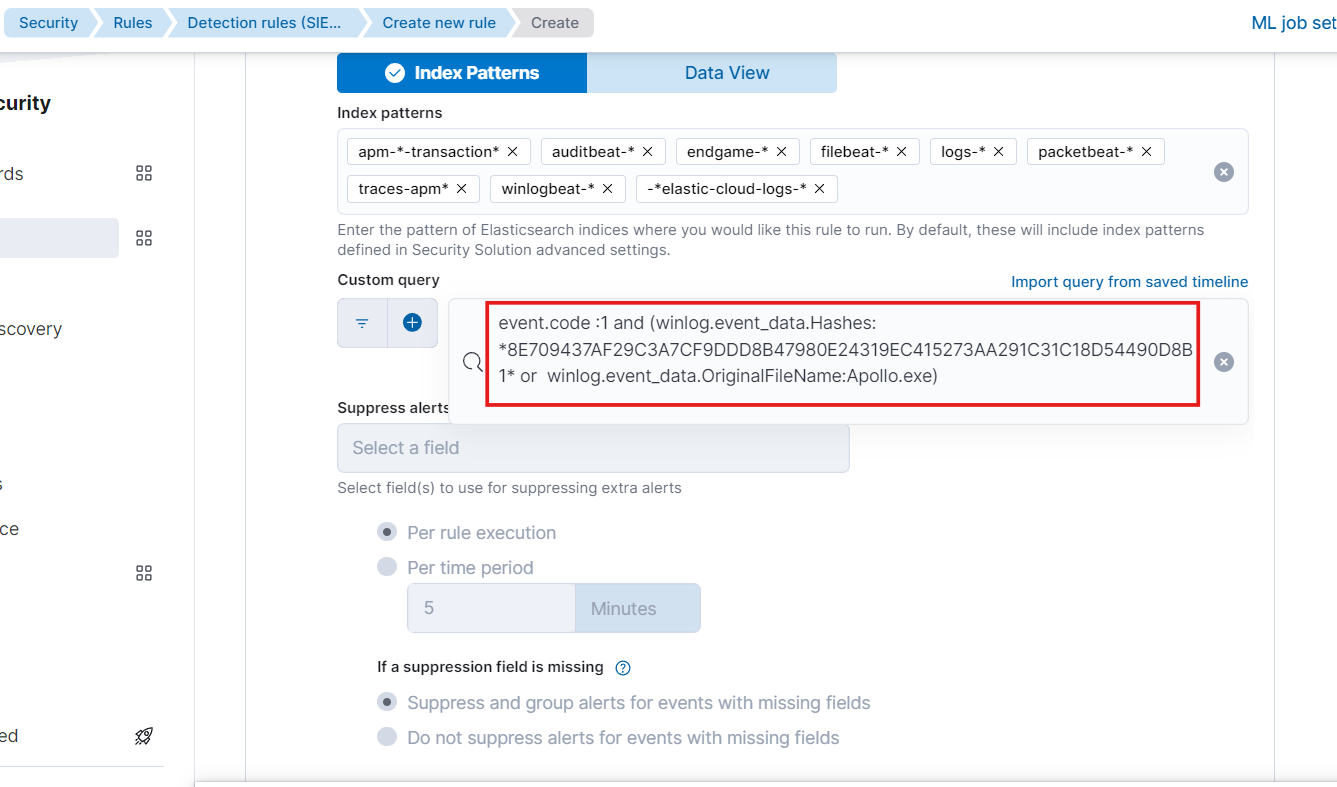
- This will be our final query for alert which includes event code as 1 which indicates the process creation, file hash, original filename with or condition. The or condition is used because we want either the original file as apollo or the matching hash for malicious payload. we removed the payload name because the name can be anything for payload.
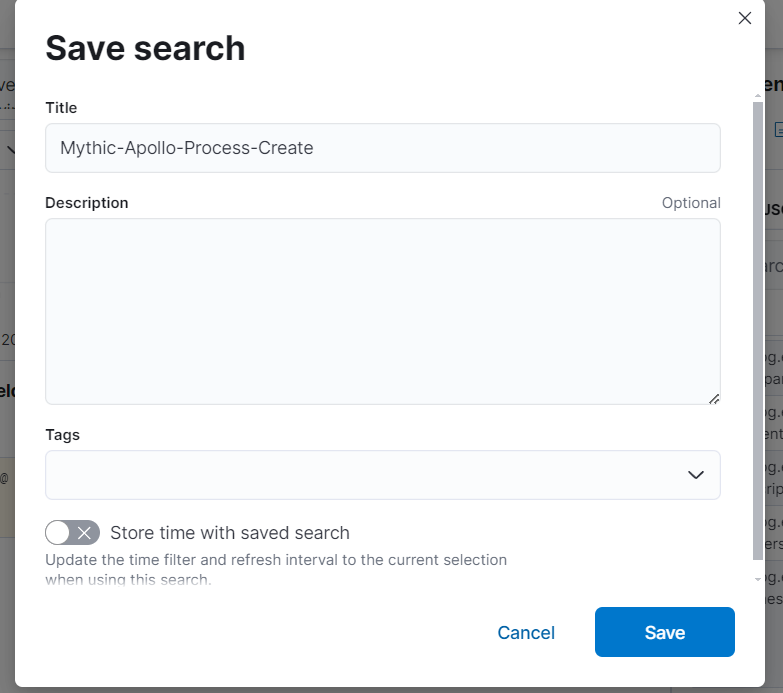
- Now save the search.
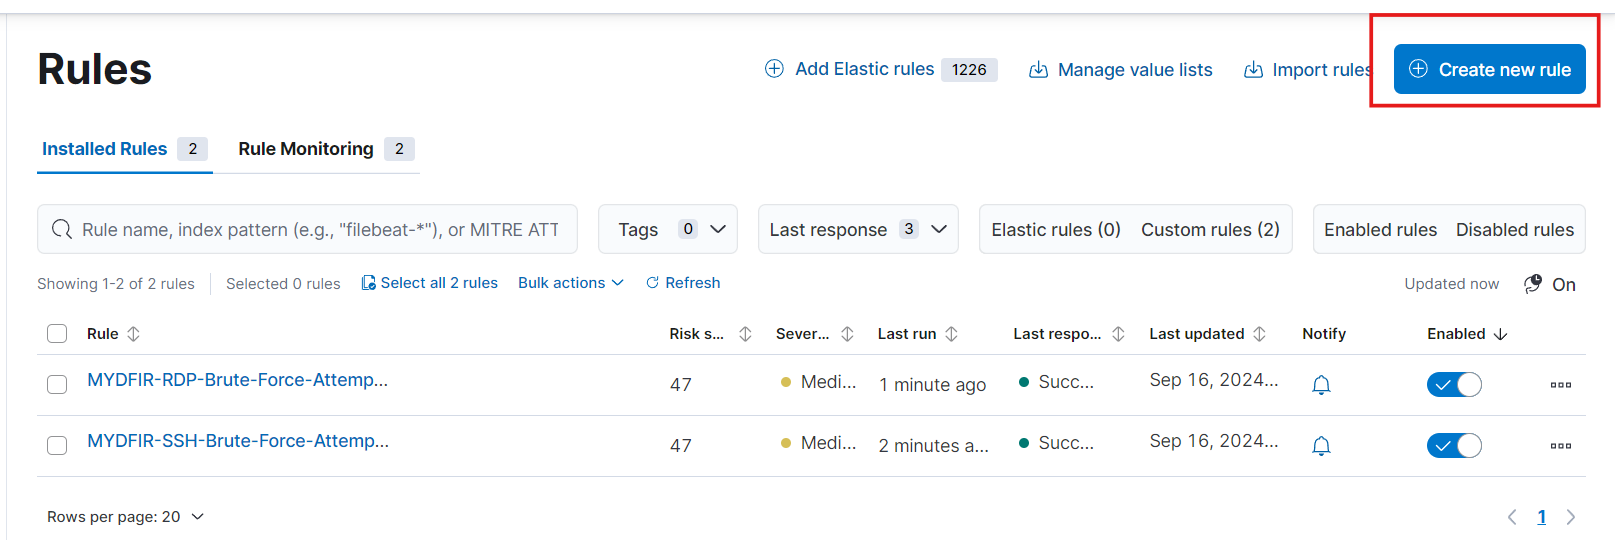
- Now, next task is to create the rules,
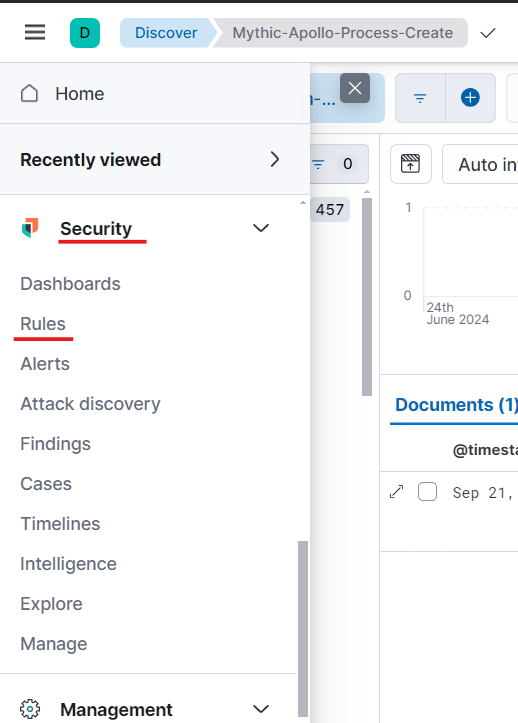
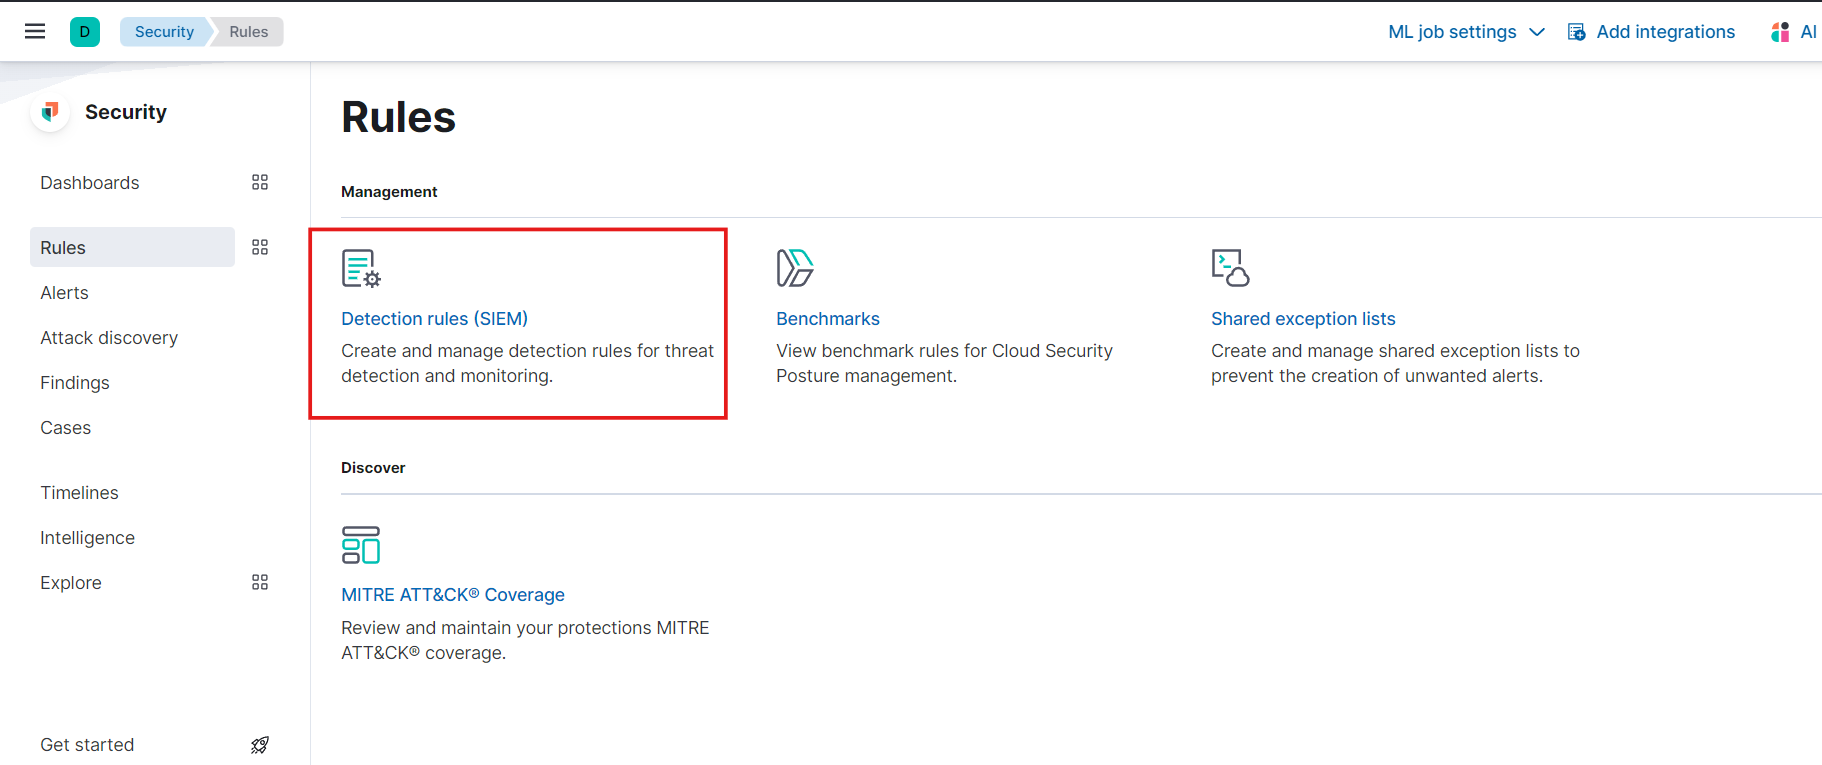
- In rules choose the Detection SIEM rules option.
- Click on Create New Rule button,
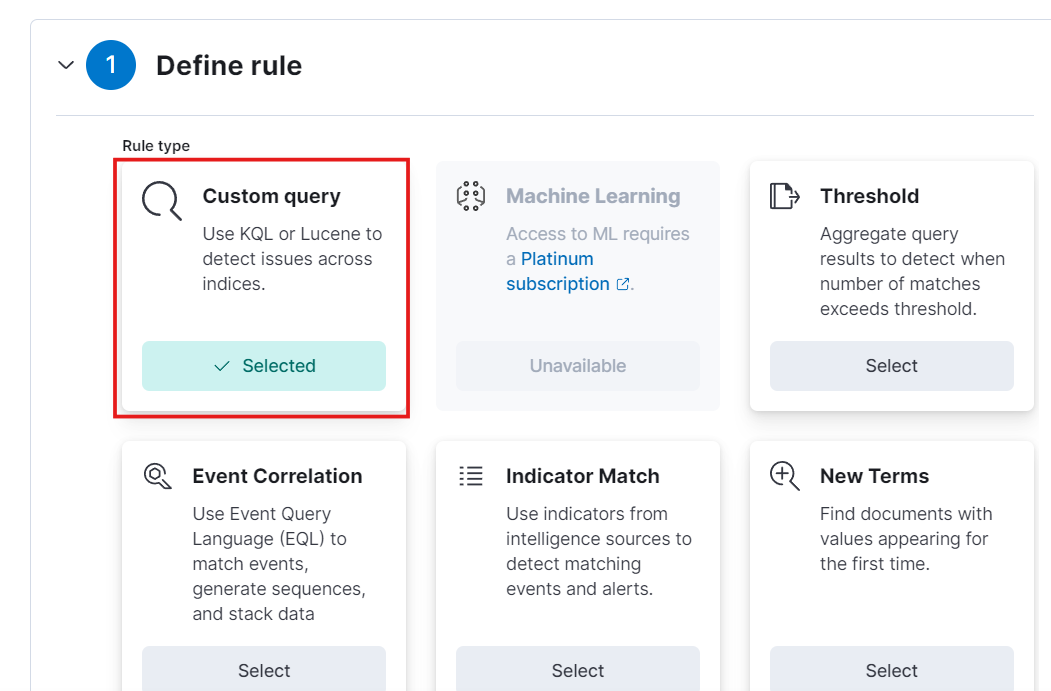
- Choose Custom Query button and paste the query we created for search.
- Keep the index pattern default.
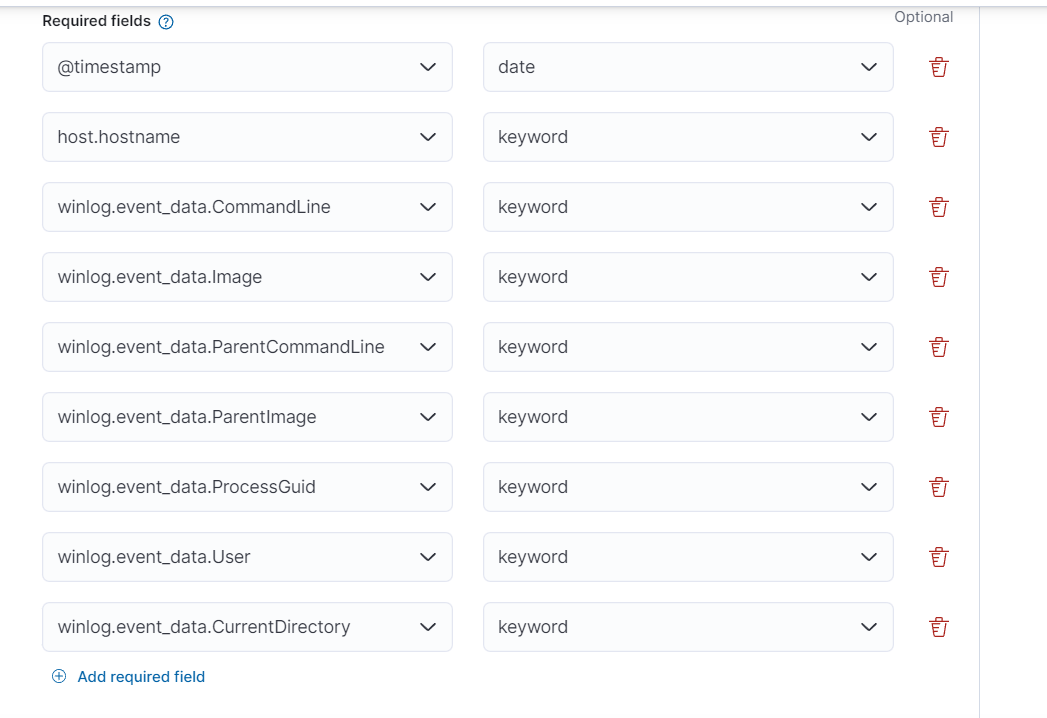
- You can choose the required field as I did. These fields are basic for log analysis and very useful as well. But if you think you need different than these, you can continue with other fields as well. Ultimate goal is your understanding for logs.
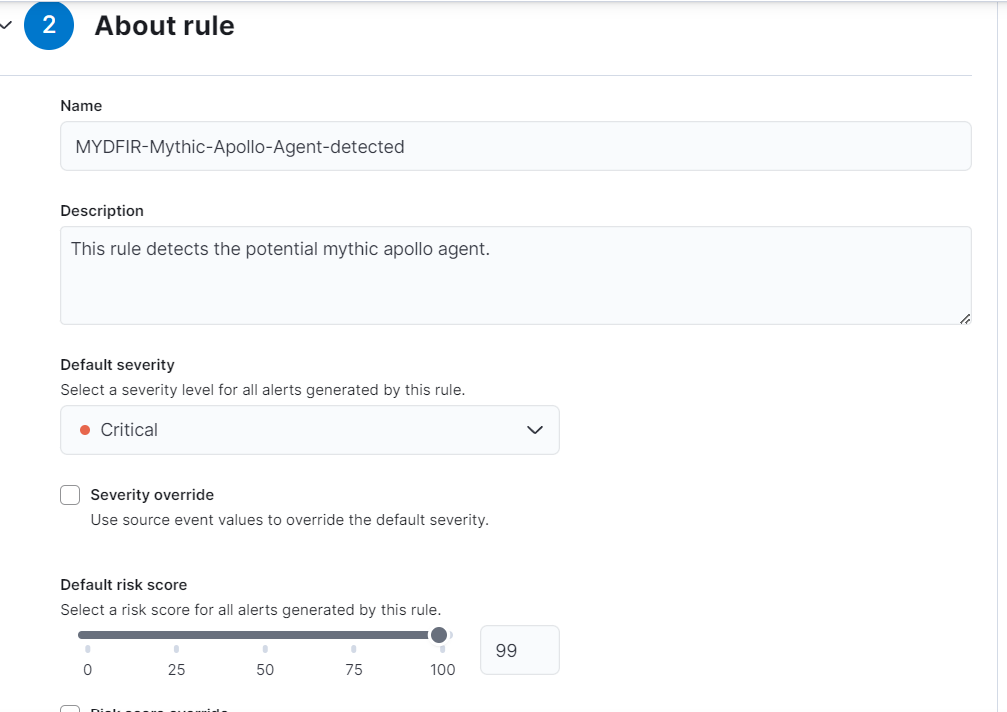
- Give appropriate rule name and keep the default severity as Critical.
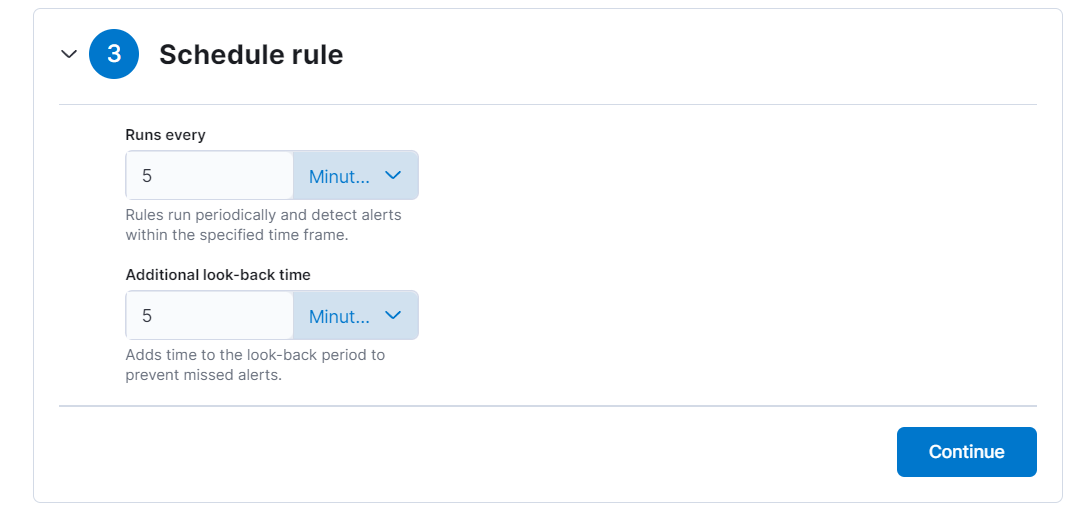
- Set the schedule t run every 5 minutes and additional look back for 5 minutes.
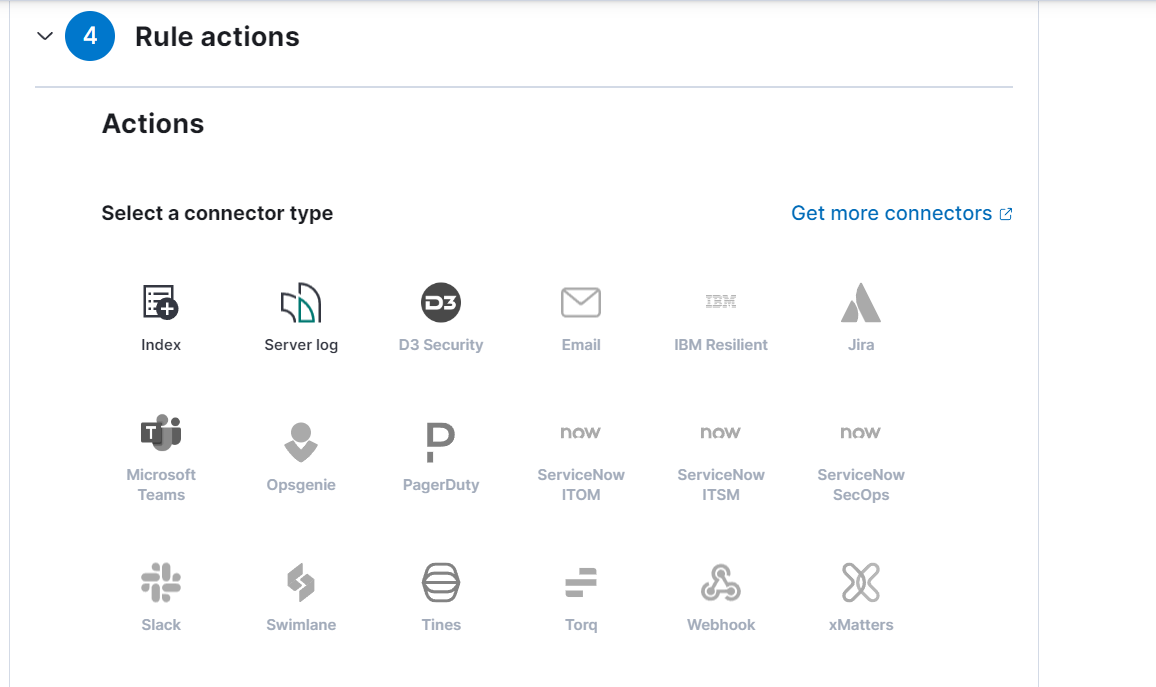
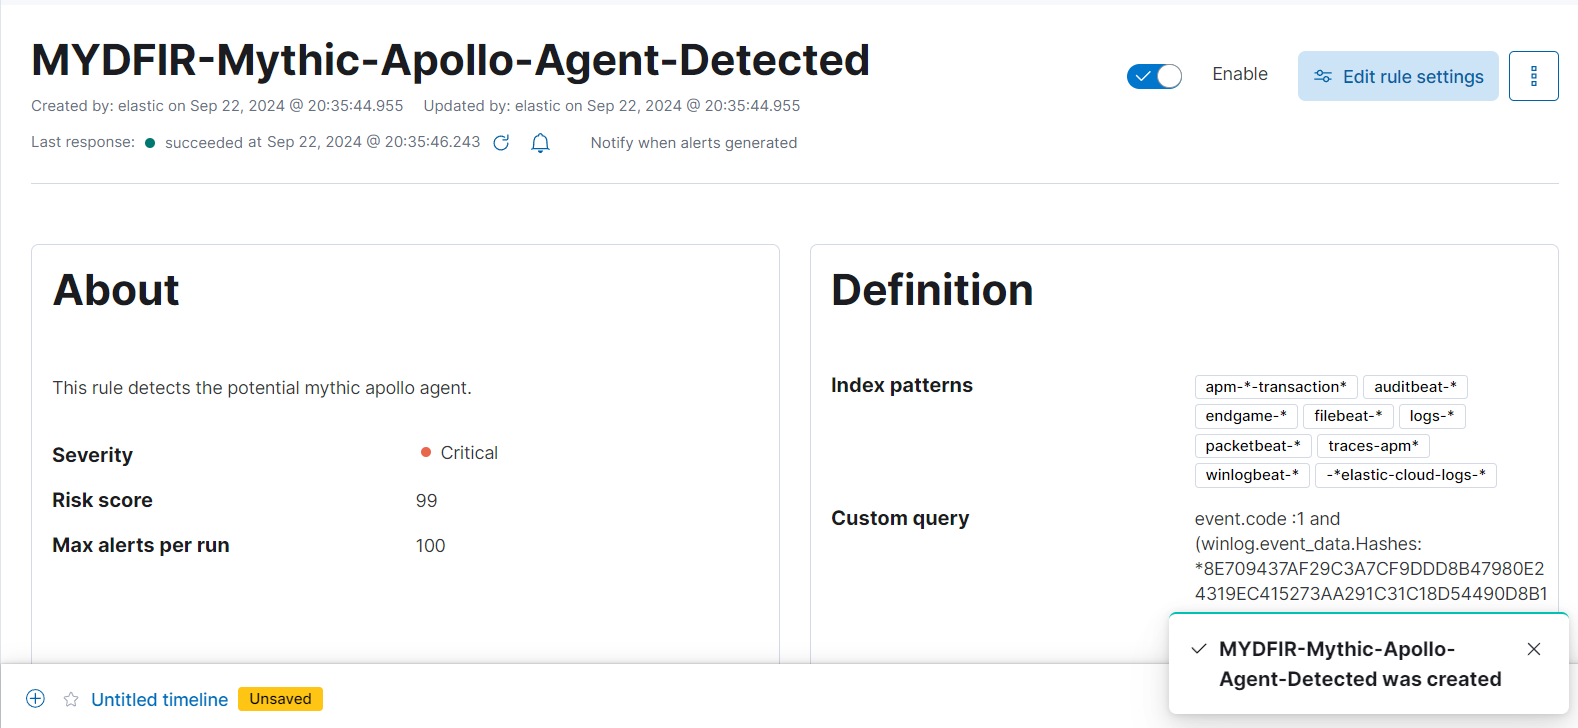
- we’ll keep the rule action default settings and Create & enable the rule.
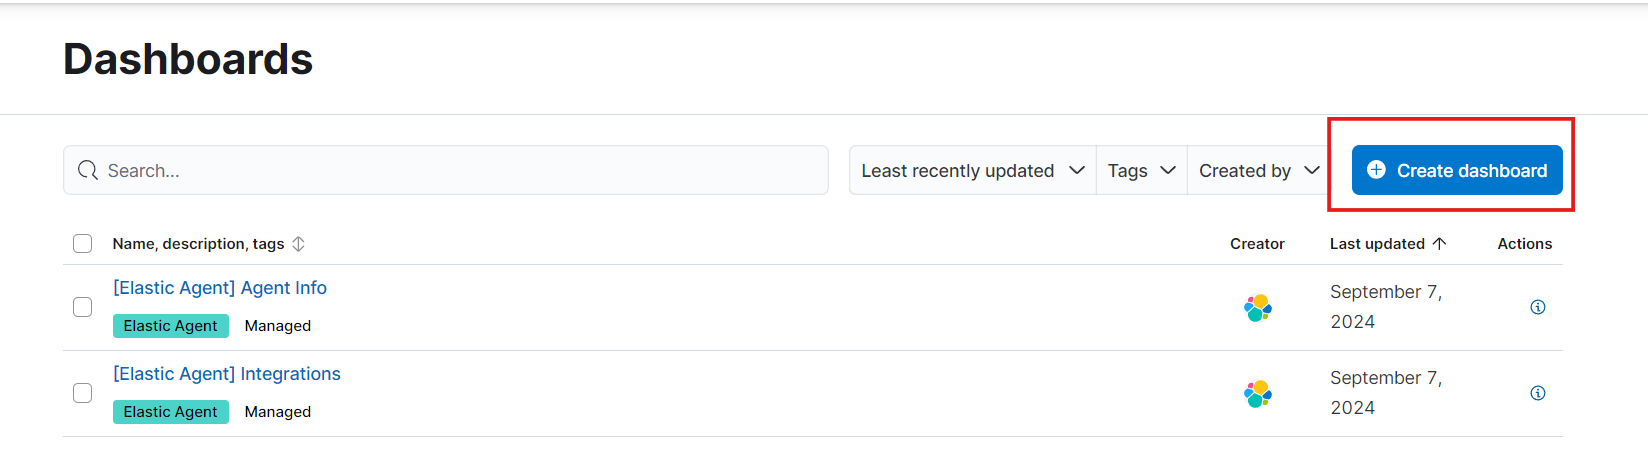
- We have a dashboard created previously for authentication activity but I would like to create a new fresh dashboard. So, let’s create new Dashboard.
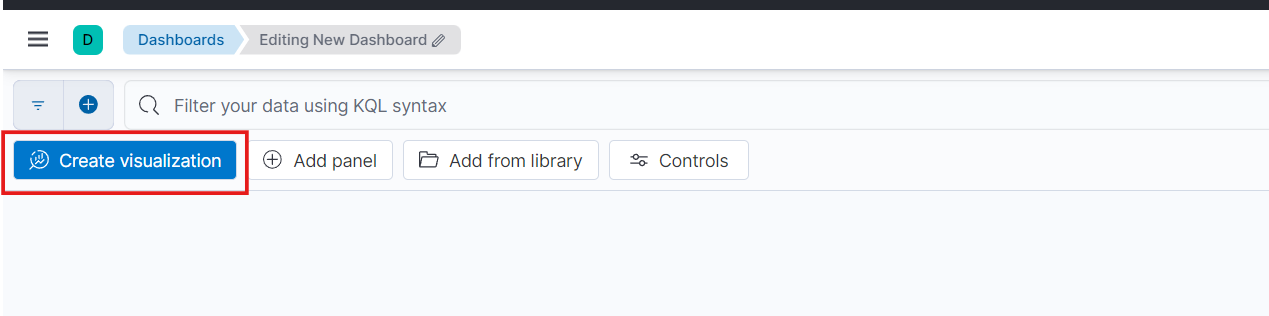
- Now, create visualization by using the queries for different event codes for different processes.
First query with event code 1 as process creation with required fields.
- Event ID 1: event.code:1 and event.provider:Microsoft-Windows-Sysmon and (powershell or cmd or rundll32)
host.hostname
winlog.event_data.CommandLine
winlog.event_data.Image
winlog.event_data.ParentCommandLine
winlog.event_data.ParentImage
winlog.event_data.ProcessGuid
winlog.event_data.User
winlog.event_data.CurrentDirectory
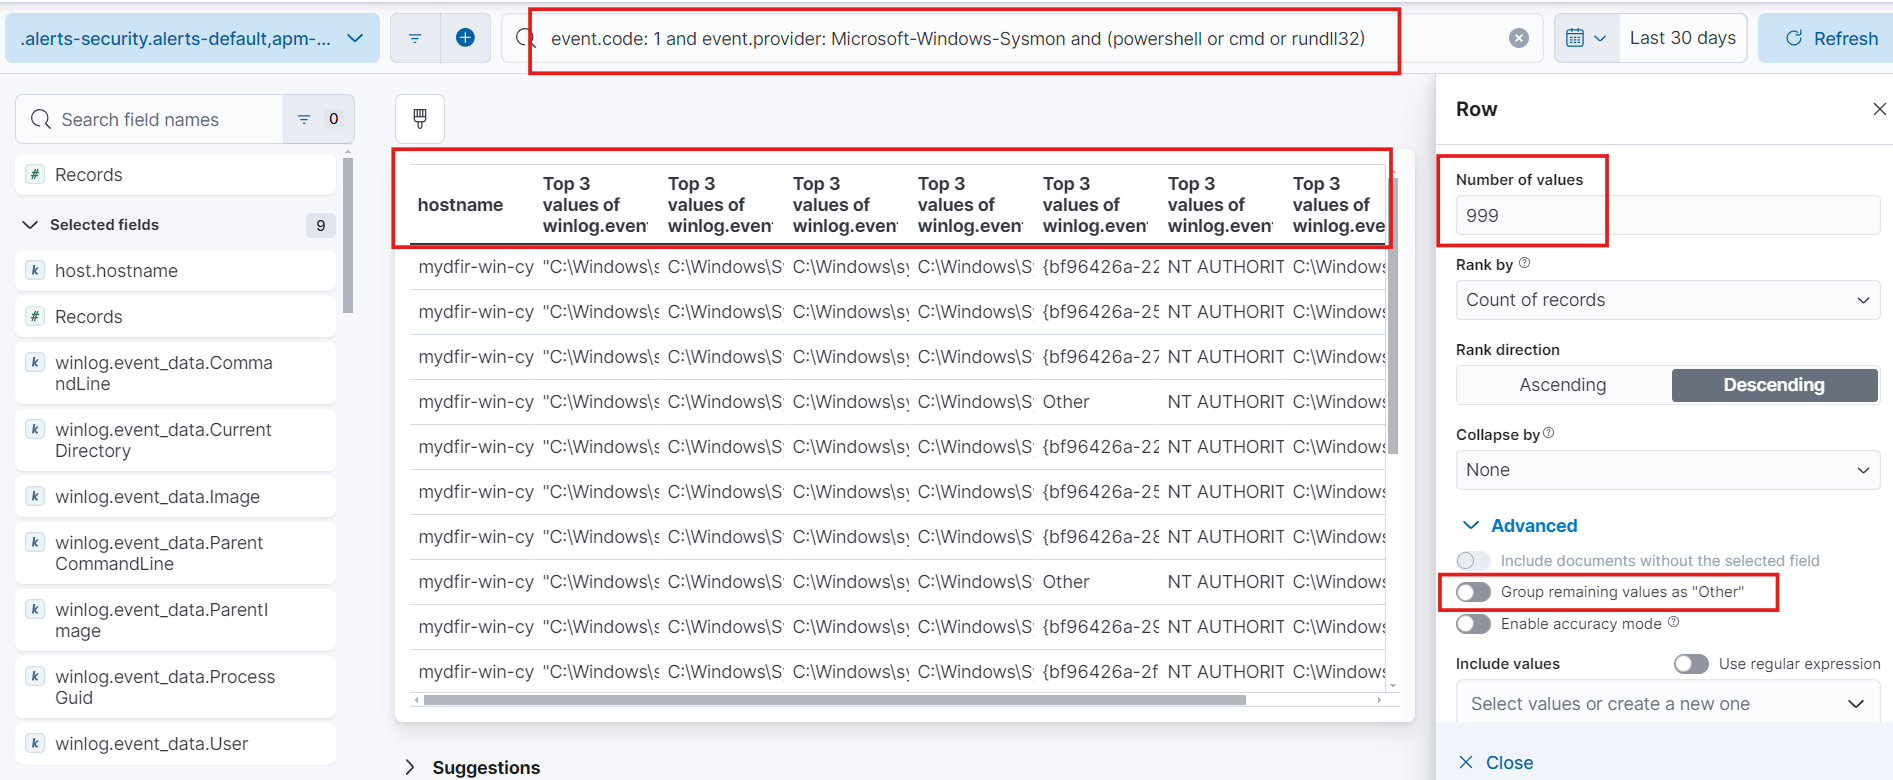
Here modify the values as 999 and change the names of fields for ease.
For next query with event code 3 with shows the process nitialization.
- Event Id 3: event.code:3 and event.provider:Microsoft-Windows-Sysmon and winlog.event_data.Initiated:true and not winlog.event_data.Image:*MsMpEng.exe
winlog.event_data.Image
winlog.event_data.SourceIp
winlog.event_data.DestinationIP
winlog.event_data.DestinationPort
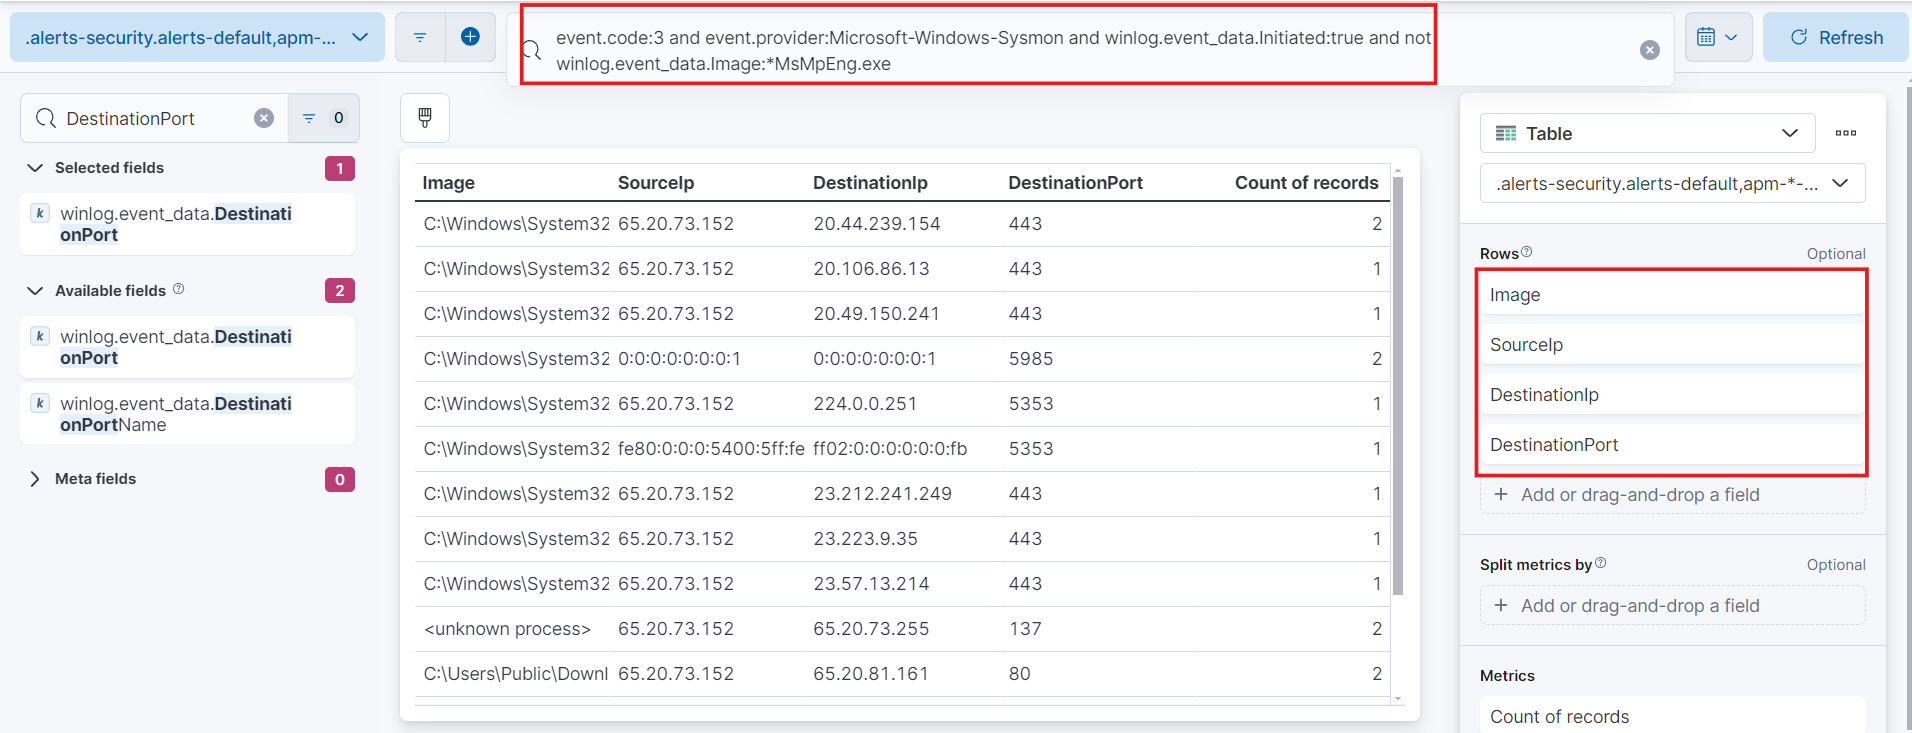
Do the same changes as above.
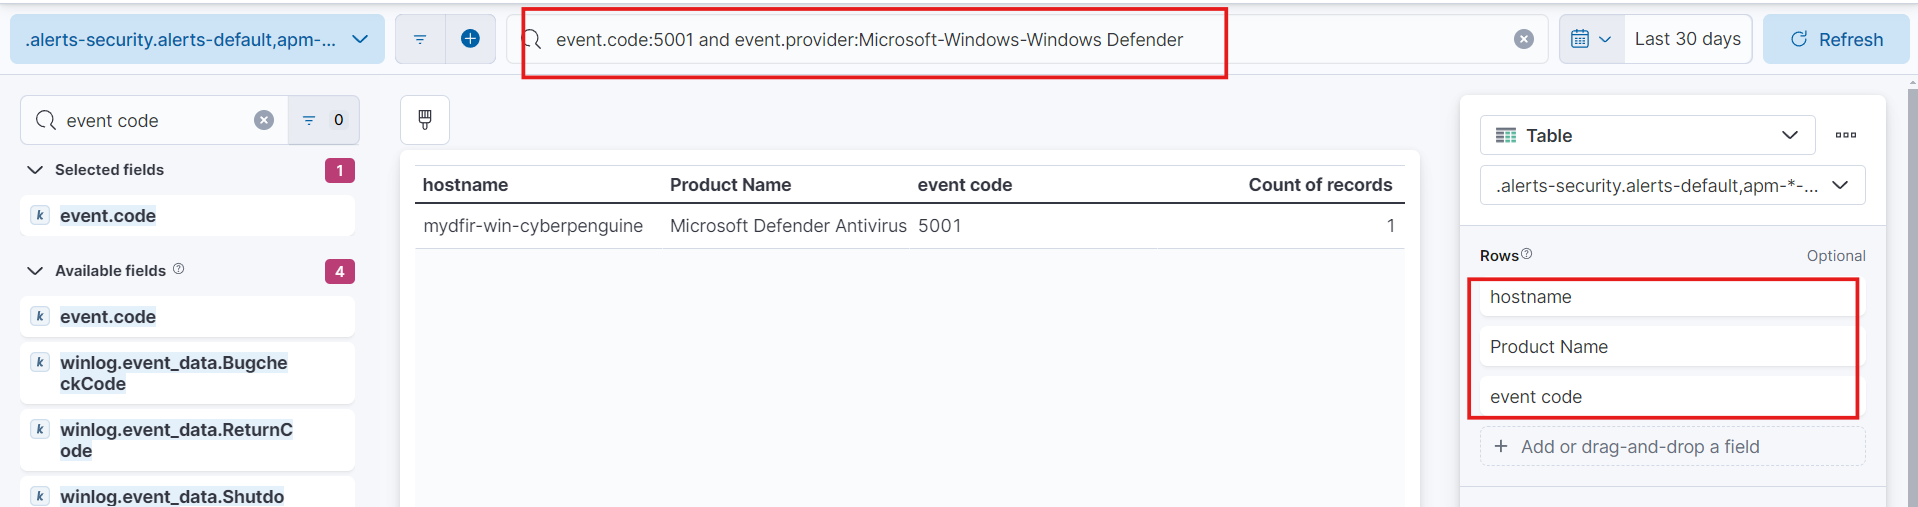
And for 3rd query we will use event code 5001. For windows defender disable alert.
- Event Id 5001: event.code:5001 and event.provider:Microsoft-Windows-Windows Defender
host.hostname
winlog.event_data.Product name
event.code
Everytime you create visualization do not forget to click on save and return button.
Now, this how the dashboard will look like with three new visualizations.
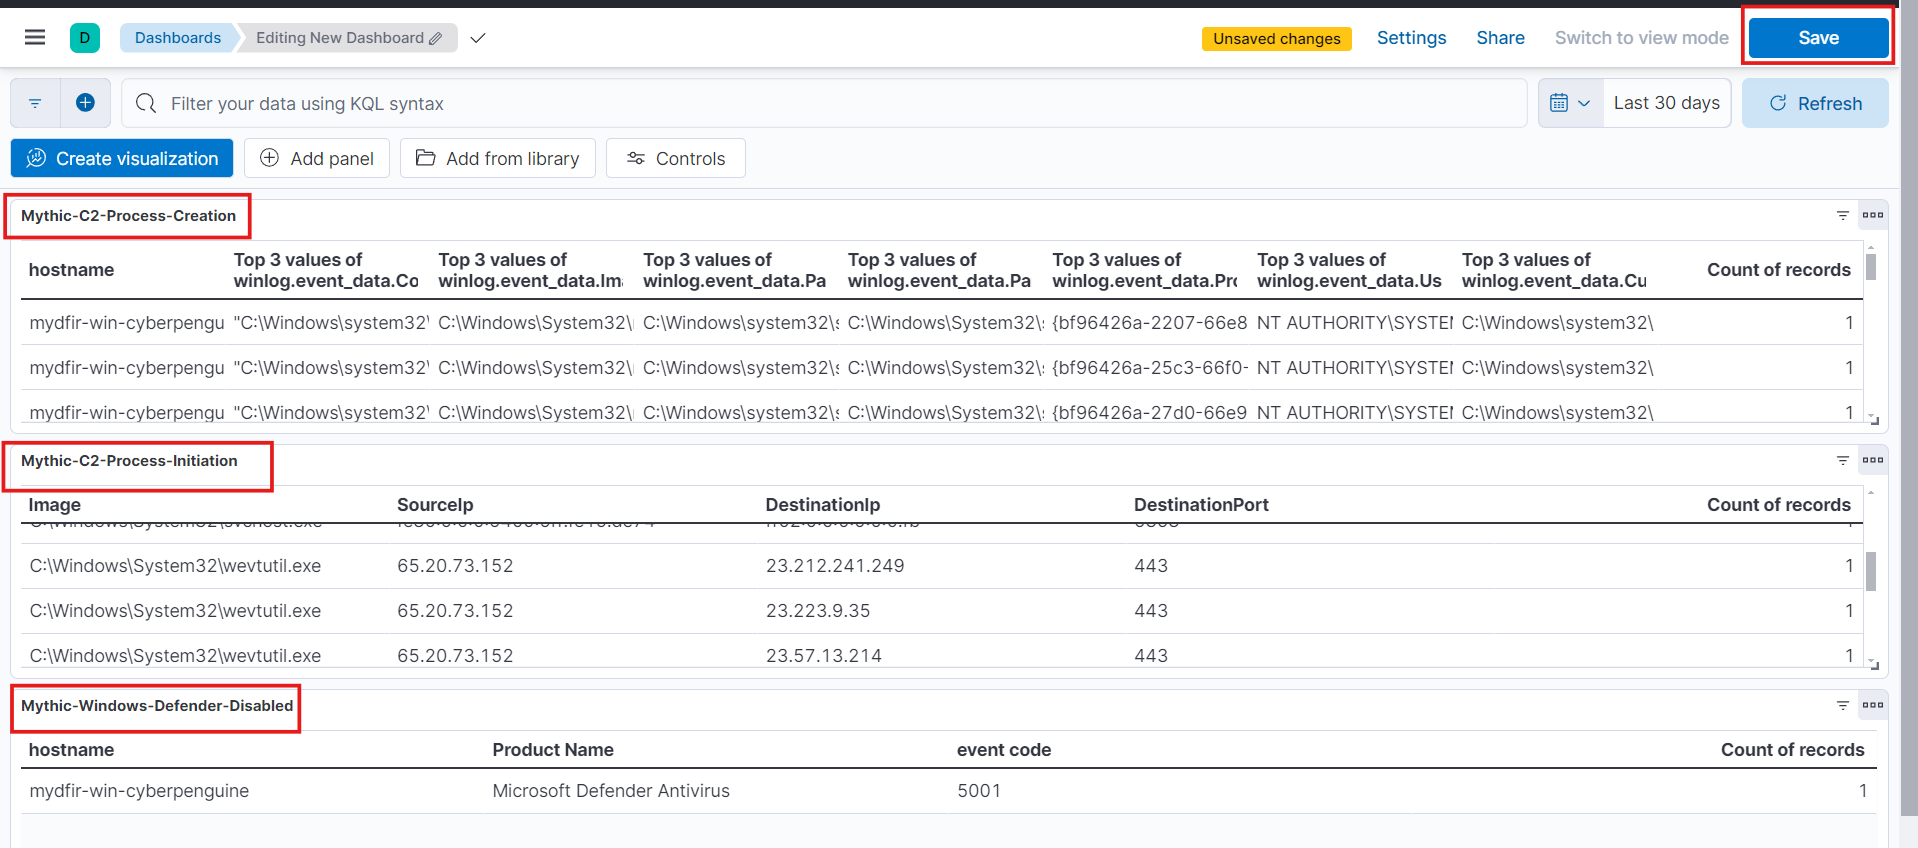
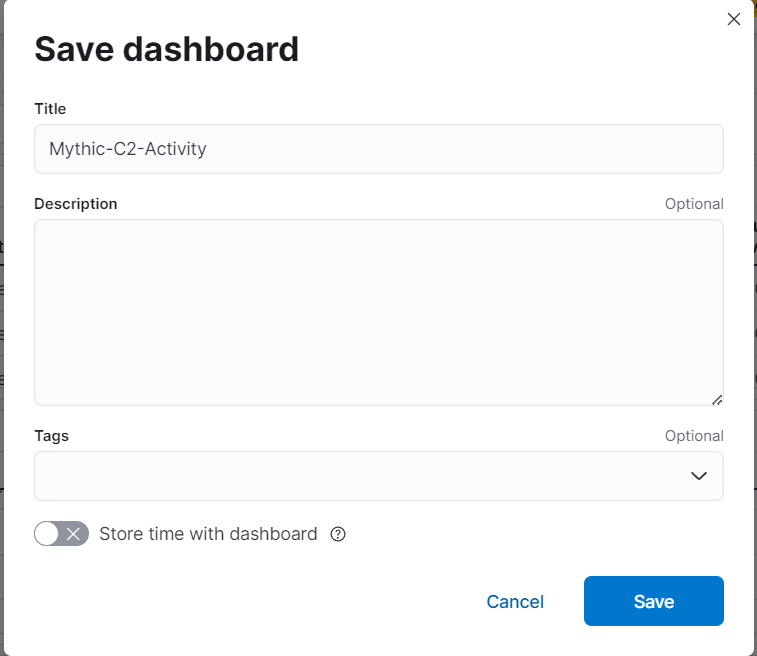
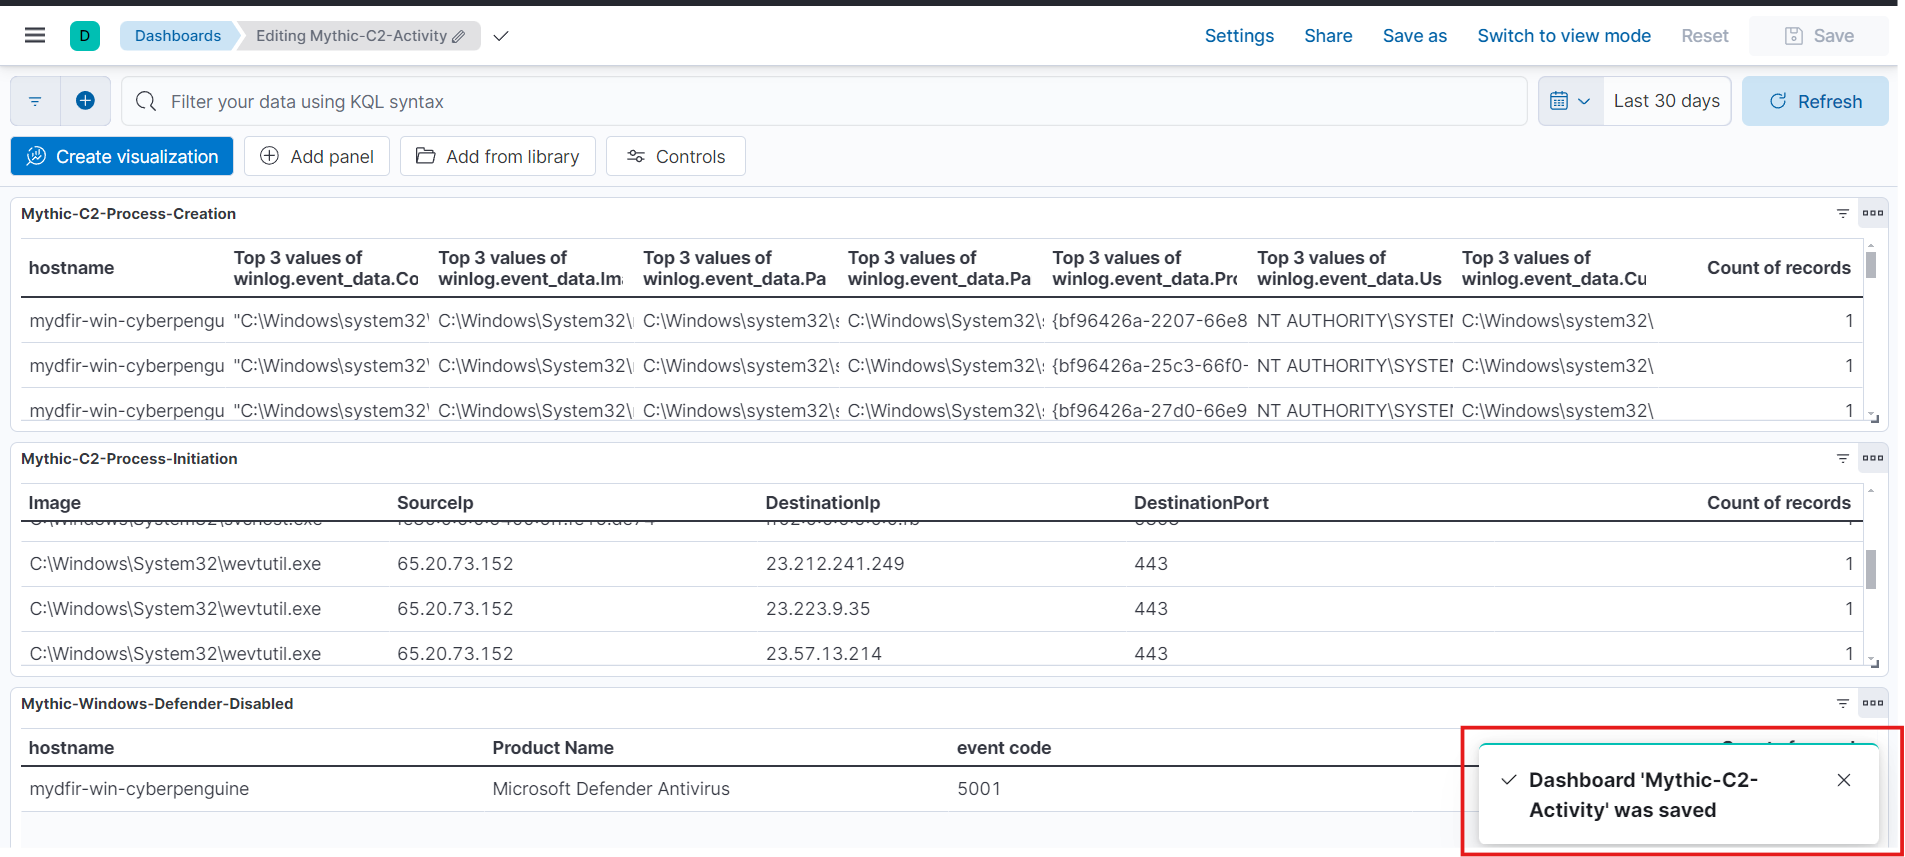
- Don’t forget to save the dashboard.
- And done.
Today we practiced creating alerts and dashboard for mythic. If you have any suggestion or doubts please reach out to me on linkedin. Stay tuned for next informative blog.