Day-4 Kibana Setup

Alright, let’s move on to setting up Kibana on our Day 3 adventure! Here’s how we’ll access the Kibana interface using your server’s public IP:
1. Download and Install Kibana:
- Open your server instance on Vultr.
- Head over to the Kibana download page and copy the download link for the DEB package (similar to what we did for Elasticsearch).
Download Kibana using the following command, replacing
<kibana….deb>with the actual link:#wget <kibana….deb>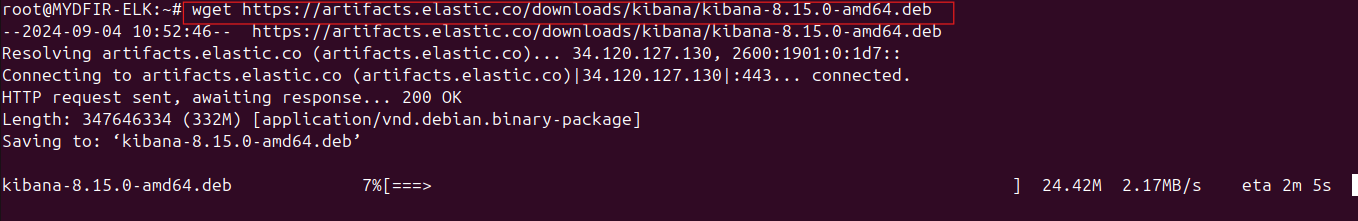
Unpack the downloaded file:
#dpkg -i <kibana….deb>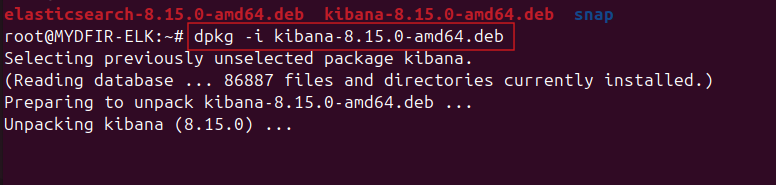
2. Kibana Configuration:
Now, let’s edit the Kibana configuration file. Go to the directory containing the file and use nano to edit it:
#cd /etc/kibana#nano kibana.yml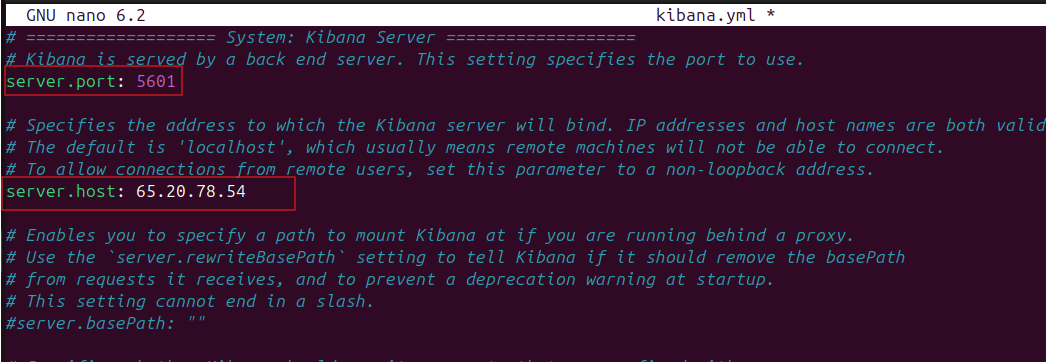
- Look for the
server.hostsetting and edit it to match your server’s public IP address. - While you’re at it, uncomment both the
server.hostandserver.portsettings.
3. Start and Verify Kibana:
We need to reload the system daemon, enable the Kibana service at boot, and then start the service itself. Run these commands one by one:
#systemctl daemon-reload#systemctl enable kibana.service#systemctl start kibana.service#systemctl status kibana.service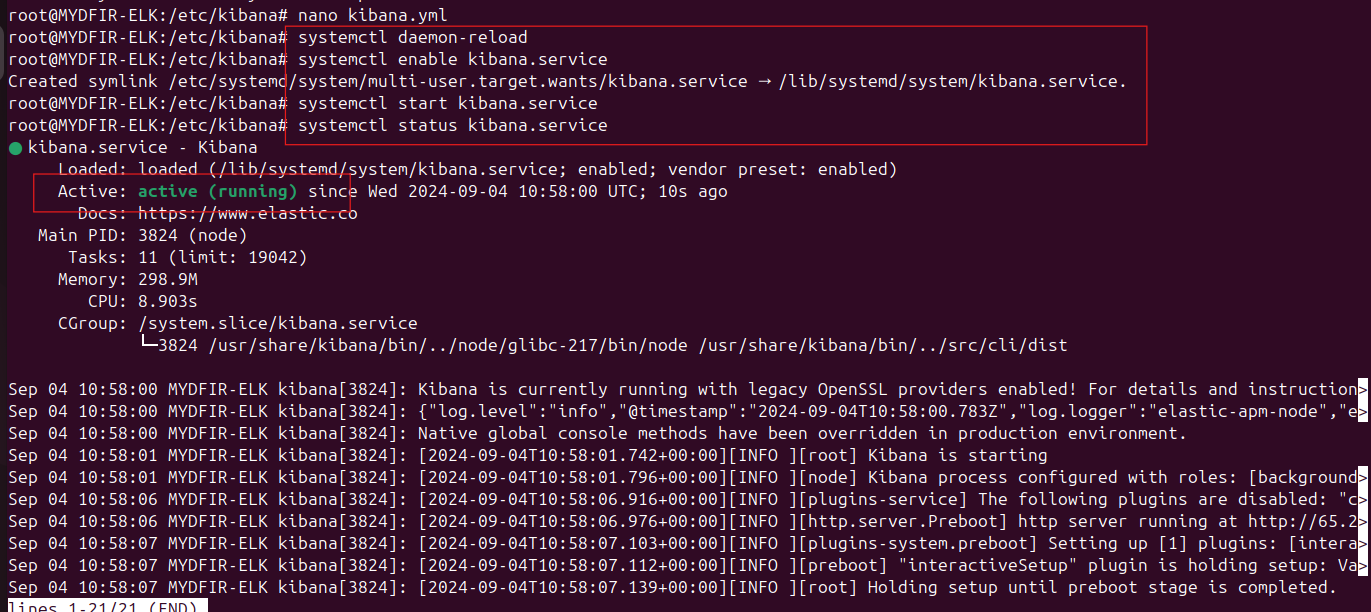
The last command will show the status of the Kibana service. Verify that it’s running.
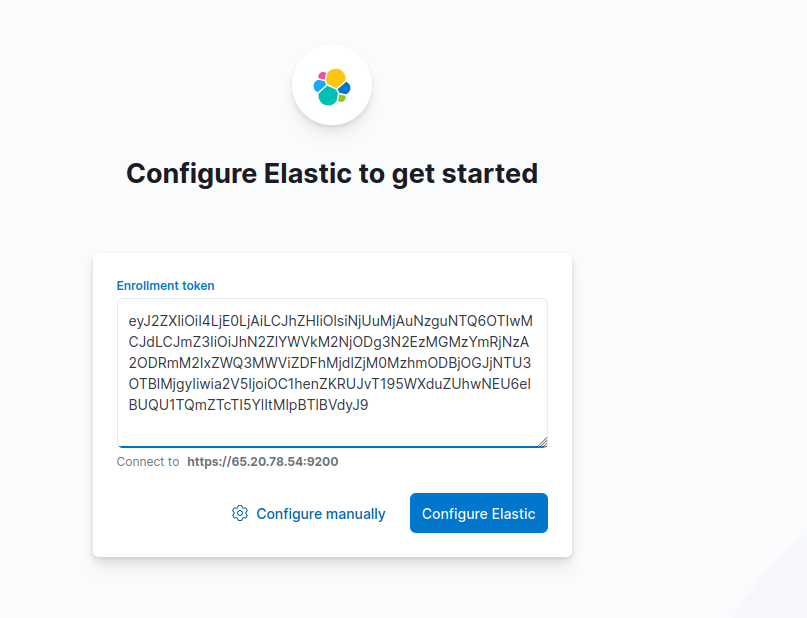
4. Generate Enrollment Token:
To access Kibana, we’ll need a special token. Let’s change directories first:
#cd /usr/share/elasticsearch/binNow, generate the token using the following command:
#./elasticsearch -create-enrollment-token --scope kibana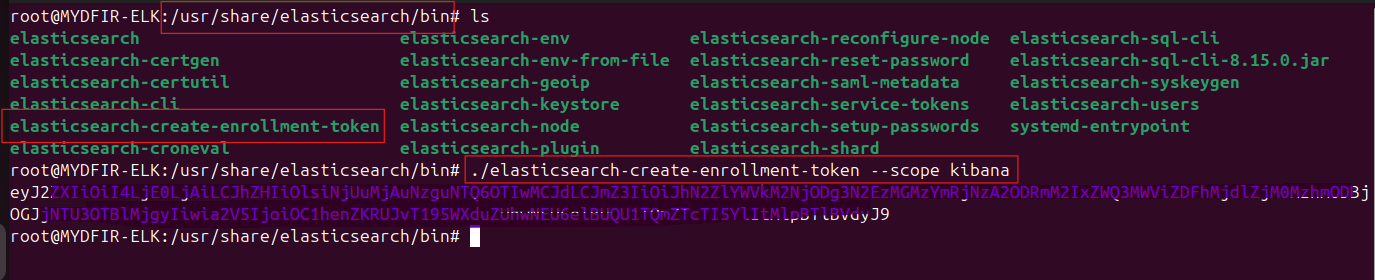
Copy the generated token.
5. Access Kibana Interface:
Open a web browser and navigate to your server’s public IP address, followed by the Kibana port number (usually 5601).
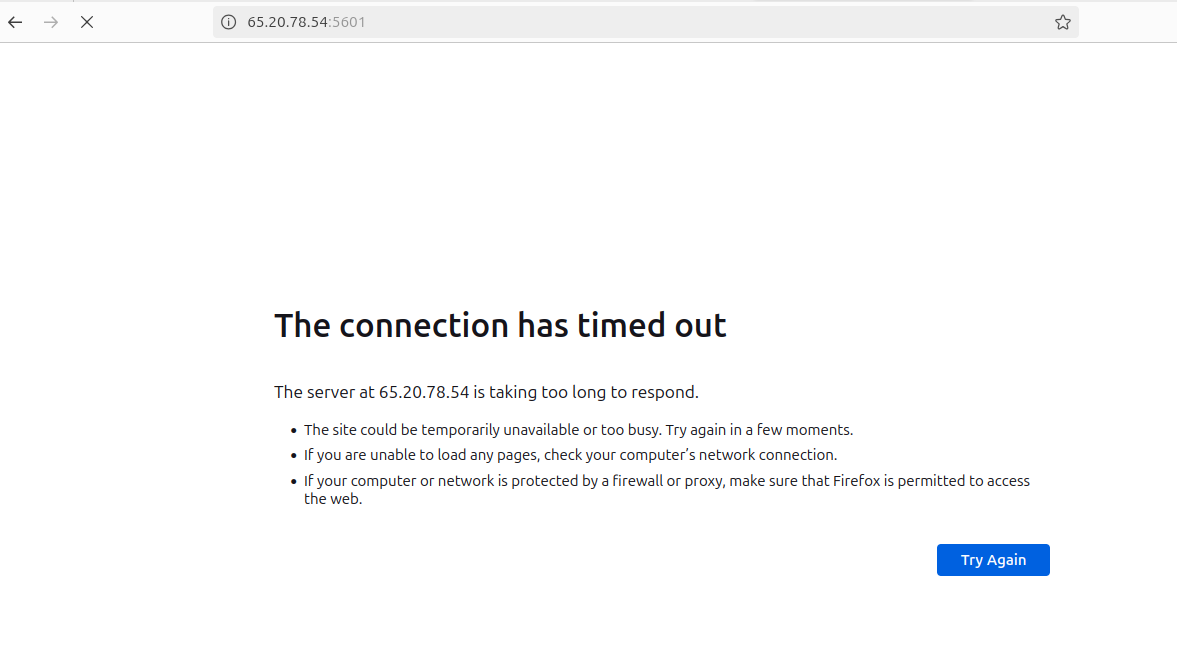
Troubleshooting:
If you encounter a “site unreachable” or “timeout” error, you might need to adjust your firewall settings. Add a rule to allow access on port 5601 and restart the firewall service.
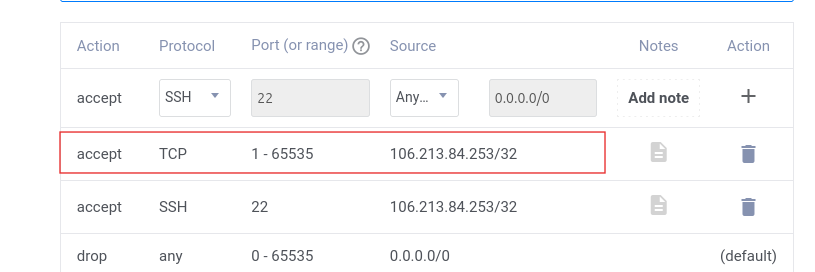
And if still it’s not working then you can use commands like
#ufw allow 5601for firewall management.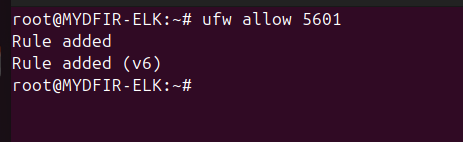
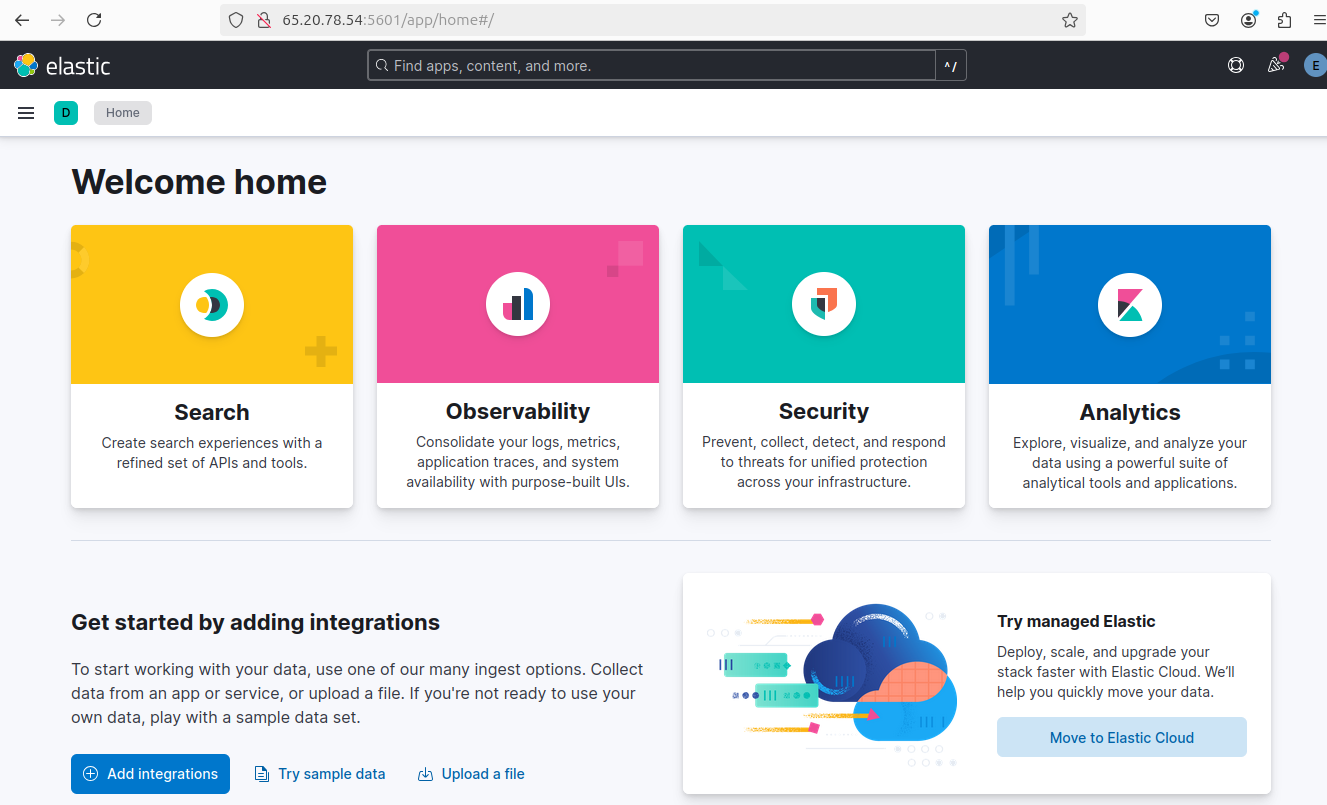
Once you’ve addressed the firewall issue, refresh the page in your browser. Now, you should be able to see the Kibana interface.
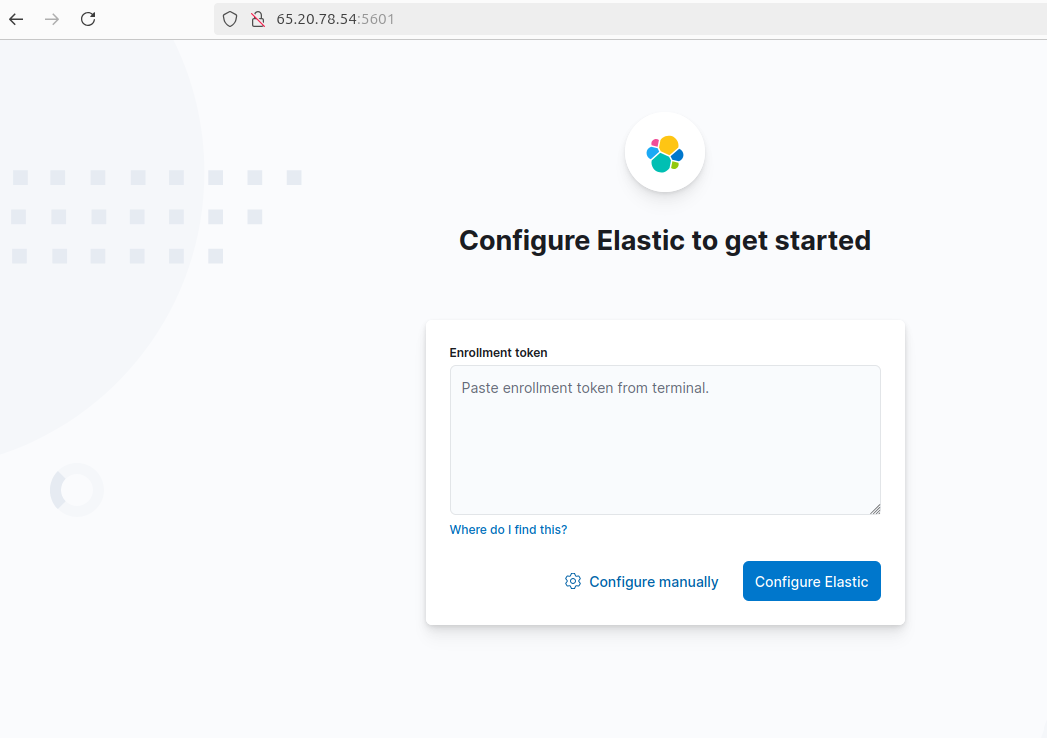
6. Login to Kibana:
On the interface, you’ll be prompted to enter the enrollment token. Paste the token you copied earlier and click “Configure Elastic”.
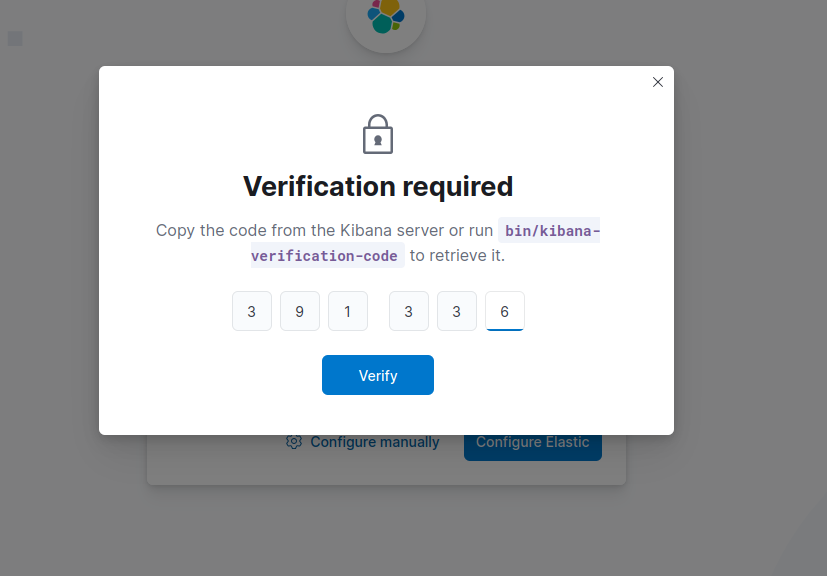
7. Verification Code:
To get the verification code, navigate back to your server instance and run:
#cd /usr/share/kibana/bin#lsThis will list available commands#./kibana-verification-code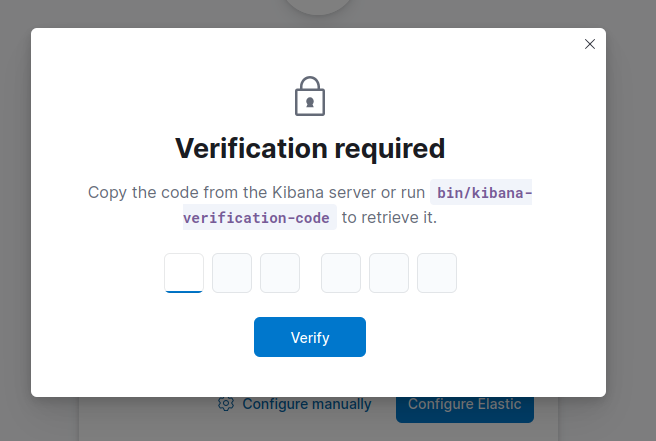
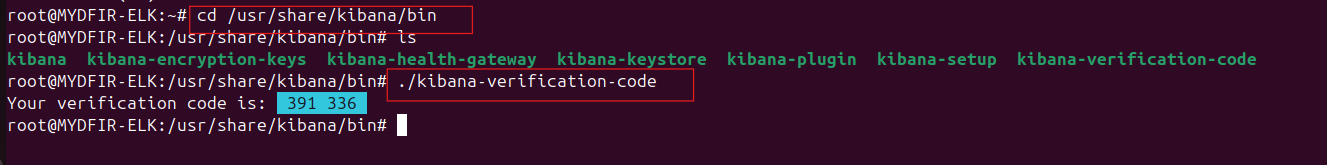
Copy the verification code displayed.
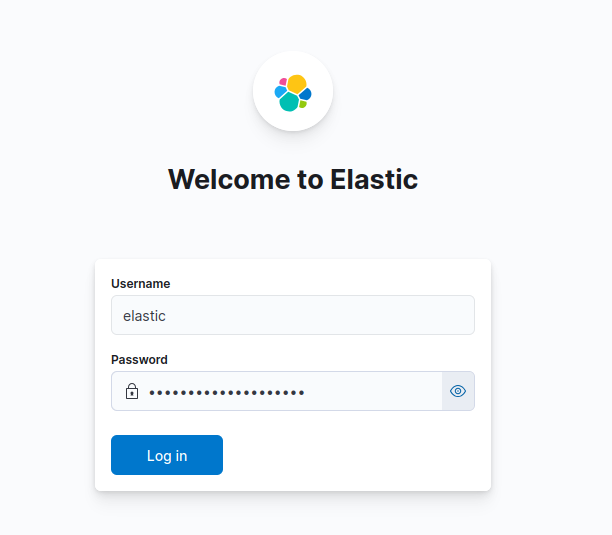
8. Enter Credentials:
Now, you should see a login prompt. Remember that security configuration screen you got earlier? Use the username and password listed there (usually username: “elastic” and password found in the configuration). Enter these credentials and log in.
9. Encryption Keys:
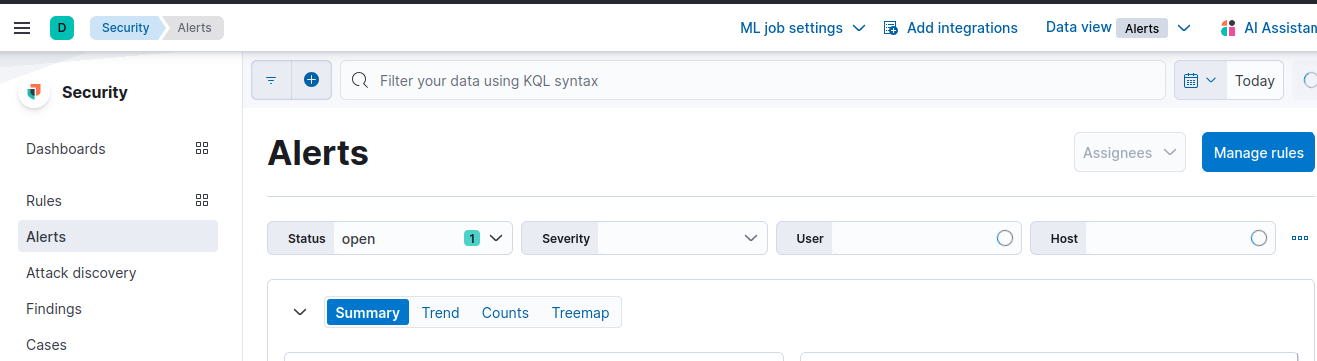
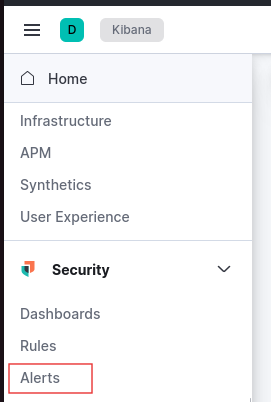
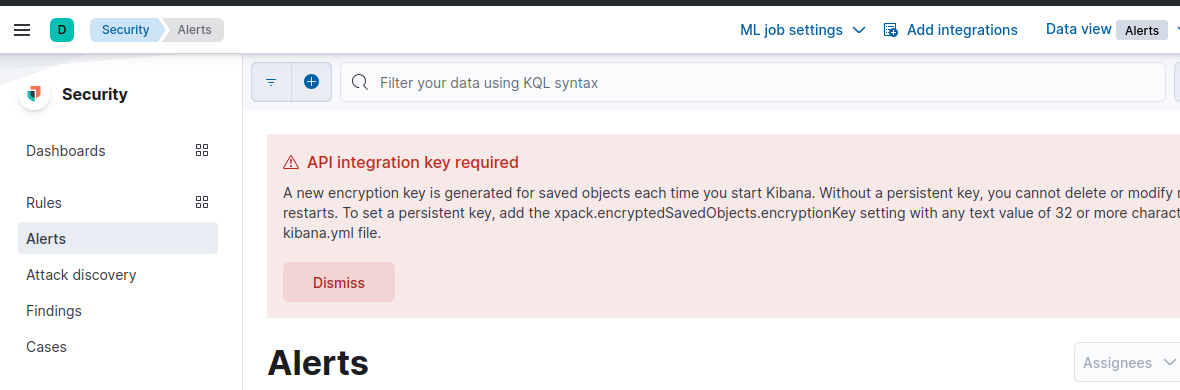
The last step involves adding encryption keys. Click on the hamburger menu (three horizontal lines) in Kibana, then navigate to Security > Alert. You’ll see an alert prompting you to add encryption keys.
Back on your server instance, navigate to:
#cd /usr/share/kibana/bin#./kibana-encryption-keys generate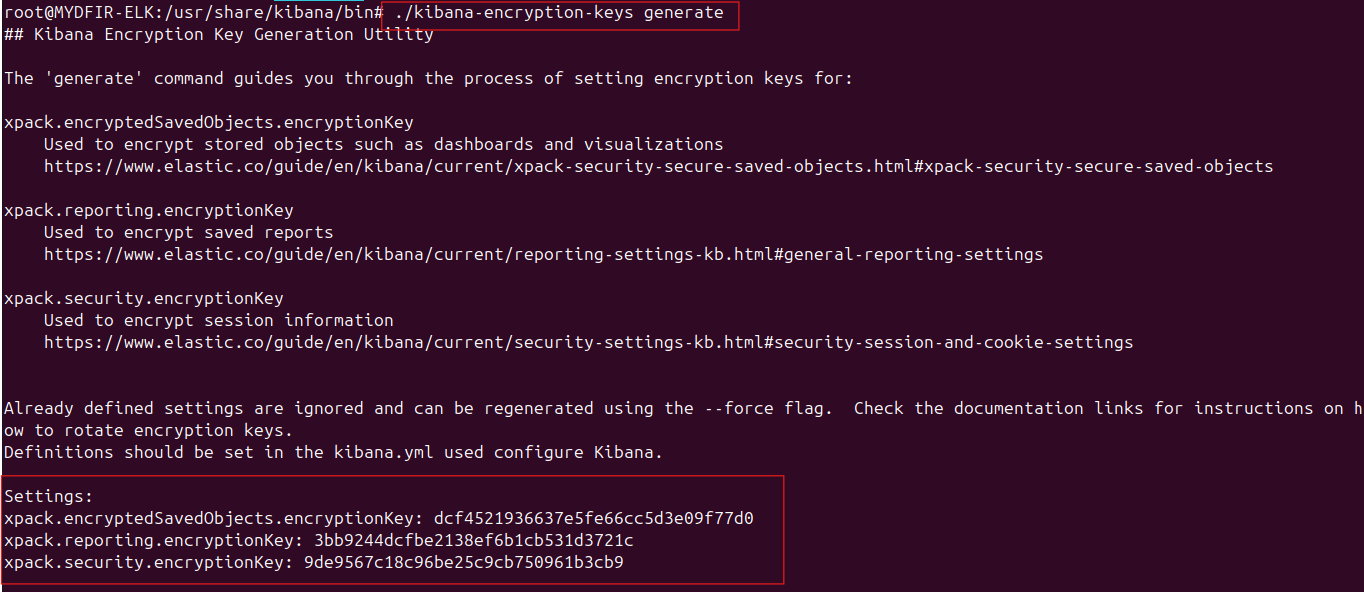
- Copy the keys displayed in the “Settings” section and paste them into a notepad.
Use the following command (replacing
<name_of_the_key_without_colon>with the actual name) to add each key:#./kibana-keystore add <name_of_the_key_without_colon>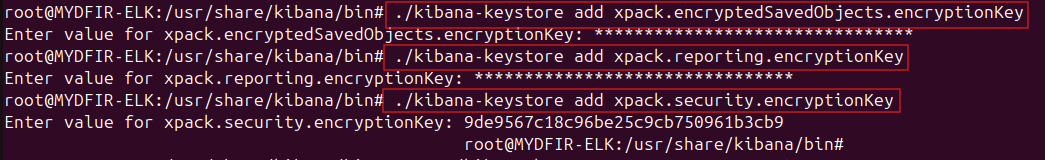
- You’ll be prompted to enter a value; provide it, and repeat this two more times to add all three keys.
10. Restart and Enjoy!
Finally, restart the Kibana service:
#systemctl restart kibana.service- Go back to your browser, refresh the page, and enter your credentials.
Now, you should be able to enjoy using the Kibana interface!